Pattern formations with entry and exit points in Betfair graphs
We already talked about support and resistance levels and trendlines when applying technical analysis in Betfair graphs. Pattern formations though are literally hundreds in technical analysis.

Given the fact that Betfair graphs don’t provide the necessary detail like stock charts, a thorough study of formations and technical analysis isn’t needed apart from basic terms. Despite that, we need to know and recognize a couple of pattern formations since they are often in Betfair’s horse racing betting graphs.
Learn about Betfair trading and read the latest news about sports trading in my new trading blog!
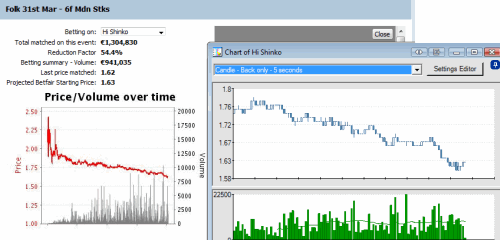
To begin with, we’ll quickly take a look of a betfair graph where the trend is constant and is never interrupted prior the start of the horse race. We can also notice a trend acceleration seconds before the official start time of the race, mainly due to traders closing their open positions and bettors who have waited until the last moment to verify the crowd’s general belief. Besides it is the last chance for someone to bet. Some bettors don’t want to reveal their bets too early. Of course in the given example, the odds might have seemed too low for their taste in the end.
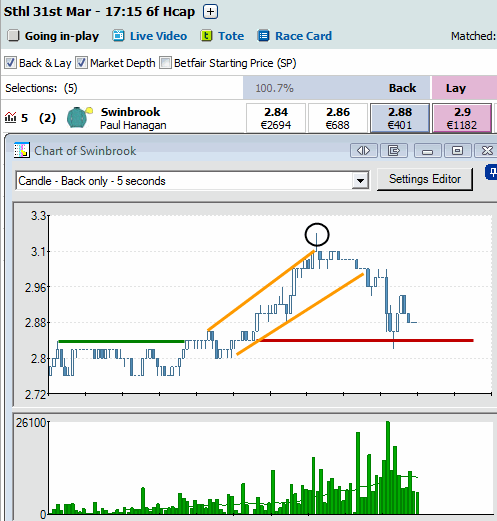
Moving on and without diverging a lot from the previous example, I have drawn a couple of lines in the following Betfair graph. If you have been reading my previous articles regarding technical analysis on Betfair graphs, you’ll easily point out the support and resistance levels and the trendline as well. In this specific chart, I also drew the uptrend channel with orange lines. I guess it is easily understood how I did that. But I have also included a candlestick formation in this graph highlighted in a circle. That candlestick formation exhibits the layers’ last attempt to move the odds even higher but they fail to succeed. It is the last sign of trend’s strength which is exhausted at that point (exhaustion bar). That particular formation is a reversal sign of the trend, or at least a sign that the trend has ended and may now enter a ranging channel. If we had laid in the beginning, it would have been a great time now to exit. Afterwards, the inactivity of the odds movement following would be another good signal to exit our trade. And if that wasn’t enough to persuade us, the interruption of the main trendline is the last verification sign that the odds are going to fall. And they fall up to the support level as expected.
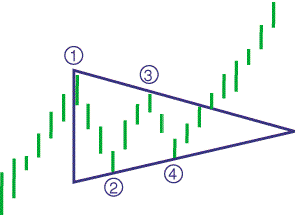
In the Betfair graph below we stumble upon one of the most known pattern formations in stock charts. The ascending triangle, that is formed if we connect the highs and lows of the odds, will show us the predicted odds movement. Predicting that movement doesn’t seem that hard, since the uptrend side of the triangle sets the trend, while the horizontal triangle’s side is the resistance that is about to be broken. Obviously it isn’t absolutely sure, but most of the times the scenario is repeated. Additionally, a similar kind of prediction can be made in case the triangle is inverted (descending triangle). There is also one more triangle formation that I need to be mentioning, the so called symmetrical triangle.The odds movement continuously calms down up to the triangle’s top. At that occassion the odds movement can be predicted when the price breaks either side, which would mean either a continuation of the trend or a reversal. At the specific example, I have also drawn the trendline that follows (green line), which will signal our trade’s exit.
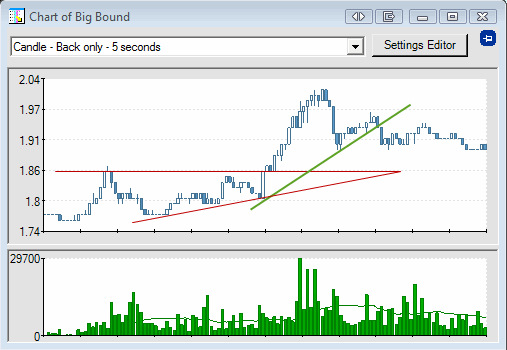
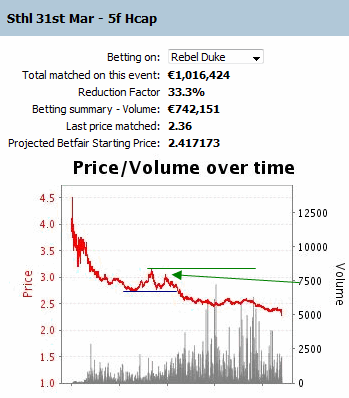
In the last betfair graph, apart from support and resistance levels, we come up with another very important element of pattern formations in charts. It is about the odds’ failed attempt to reach the previous high or low. Pointed out by the arrow, the odds couldn’t reach the resistance level for a second time. They tested but failed. It is one more sign that the odds will go lower. Similar chart formations are double up or double bottom, which can be seen when the odds manage to hit the previous high or low respectively. In both situations, the signals are regarded as reversals but you need confirmation from other signals as well. Another similar approach is the so called “knock three times”, that is when the odds reach a support or resistance level 3 times. Again that would be a reversal sign.
Generally, a trendline’s interruption is the best exit point in our trading strategy, as we saw in the 2nd example. Support and resistance levels should be considered in Betfair graphs more for entry points and for better odds movement prediction. All those chart pattern formations weren’t created by luck but they are based on the traders’ psychology. We will talk about that in the future.
Member discussion