

Applying technical analysis on Betfair graphs can make money by trading even long term football events. Champions League 2008/09 has reached the semi final stage and upon looking at the 4 teams’ betting graphs regarding the winner of the competition, we can draw basic trend lines along with support and resistance lines. Technical analysis will help us to prepare our trading strategy and even predict the two teams which will reach the Final. Still, long term trading is all about making money before the event ends and the Betfair graphs offer tremendous help.
Learn about Betfair trading and read the latest news about sports trading in my new trading blog!
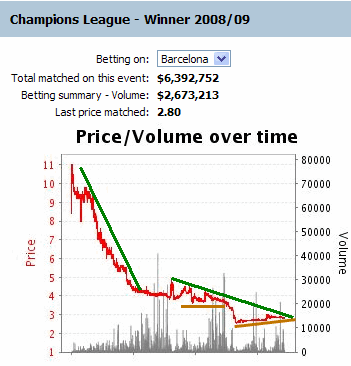
Starting out with the Barcelona’s betting graph, we notice the constant down trend of the betting odds, which shows the general trend of the betting market, although it decelerates. We shouldn’t forget that as the odds shorten, the shortening is of greater importance, since a decrease from 2.00 to 1.50 is a lot more important than a decrease from 10.0 to 7.0. Taking into account the down trend lines, there was a stabilization at around 4.00 and a support level at 3.50 which was broken and the odds shortened to 2.50. A second triangle has formed while the main down trend line continues to be valid. Barcelona is undoubtedly one of the big favorites for the title. We can risk making a prediction that their odds will fall from 2.50 to 2.00 if Barcelona starts the game well in the next leg against Chelsea. So instead of trading that game on 28th of April, we can keep an eye on this market as well. Alternatively if Barcelona doesn’t play well and the odds drift above 3.00, we can predict an elimination of Barcelona during the semi final stage.
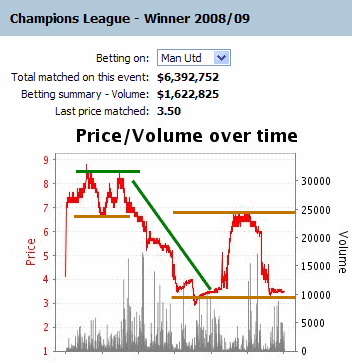
Manchester United’s Betfair graph shows some interesting signs of technical analysis. Trading after a double top in the beginning of the Betfair chart would mean taking advantage of the imminent down trend, since a double top formation is a major sign of trend’s reversal. The down trend did happen moving the odds from 8.00 to 3.00. That was another fine example of successfully applying technical analysis on graphs of long term betting markets in Betfair. The odds touched 3.00 but then they overcome the trend line and climbed to 6.60 where the last support level was found, converting into a resistance level. That was another good timing to enter the betting market downwards. The odds once again shorten to 3.25 but fail to reach 3.00 this time, proving that the last time they did was an exhaustion formation. So, we notice that the odds range between 3.25 and 6.60 (or 3.00 and 7.00). When such a situation arises, the safest trading is to be patient and enter when one of the boundaries is broken. A less safe trade would be to trade between those limits but long term betting markets don’t allow significant odds fluctuations in a trading channel.
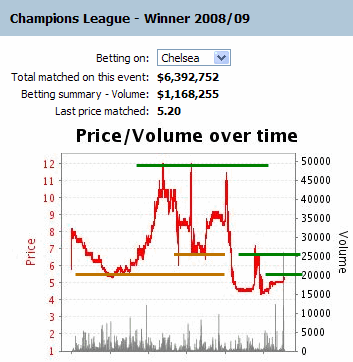
Chelsea’s Betfair graph is of great interest regarding both trading and betting. Let’s analyze every odds movement and draw conclusions based on technical analysis. The betting odds started shortening up to 5.50 where they found support. Then the odds drifted to 12.0 rather quickly and they retraced to 6.80. The odds touch once again 12.0 (almost a double top formation since the movement was rather violent), retrace again to 6.80 and retry to reach 12.0 but fail. That failure was a very good sign of an imminent down trend, which led the odds below the previous support level. Afterwards, the support level converts into a resistance level and the odds shorten to 4.50. Nowadays the odds drift up to 5.50 where the initial support level was found. Eventually the odds may meet resistance at that point. Most certainly resistance is found at 6.80. In my opinion Chelsea’s betting graph speaks of a down trend which may lead the odds even below 4.00. On the other hand, we never forget the resistance level at 6.80 for minimizing our losses.
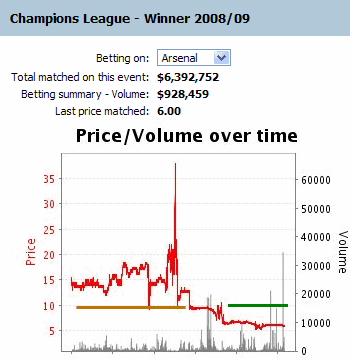
In the last Betfair graph, we notice that Arsenal’s betting odds have drifted up to 36.0! Because of the large fluctuation we can’t draw safe conclusions, since the graph hasn’t got the necessary detail in the last half of it, making the applying of technical analysis very difficult. The only certain level we can draw is the level found at 10.0 which has been changed from support to resistance. However the lack of detail afterwards makes the drawing of trend lines and indicators impossible.
As a conclusion, we could say that the safest trading exists on Barcelona’s odds, while I believe there is a good opportunity on Chelsea’s as well. However we should remind ourselves that it is a football bet we are talking about. Barcelona meets Chelsea in the semi final, making the encounter very interesting considering the analysis above. In the event of odds shortening of one team, there will take place simultaneously an odds drifting on the other team. Personally I’ll wait for the first leg’s outcome before I start a trade, since the odds will reveal the forthcoming trend. Still, we can open a position during the in-play betting of the semi final leg. If Barcelona presents a strong team in the playing field, the odds will overcome the support level, while Chelsea’s will break above the resistance level. On the contrary, if Chelsea plays well, their odds will start shortening verifying the analysis above, while in the same time Barcelona’s odds main trend will have reversed!
So, in the next fixture of Champions League don’t forget to keep an eye on these Betfair graphs instead of blindly betting on the match odds. I think there will be some nice opportunities to make money.