

We talked about support and resistance levels in Betfair horse racing charts but how about candlesticks formations in the graphs? The candlesticks provide more detailed charts and a lot more information, but if you are not aware of them you shouldn’t worry.
We can still make money trading in Betfair using trendlines, support and resistance lines using candlesticks without having a clue about them. At least for the time being as I will be explaining more about candlesticks’ formations in a future article.
Learn about Betfair trading and read the latest news about sports trading in my new trading blog!
Candlesticks are used as an alternative way of drawing a chart. Instead of a simple line corresponding to the odds movement like in the original Betfair graphs, candlesticks offer more detail to the Betfair chart. However we may still draw trendlines and apply technical analysis on them as we did in the post about the support and resistance levels in betfair graphs. Today I’ll be analyzing the Betfair charts of 5 UK horse racing betting markets.
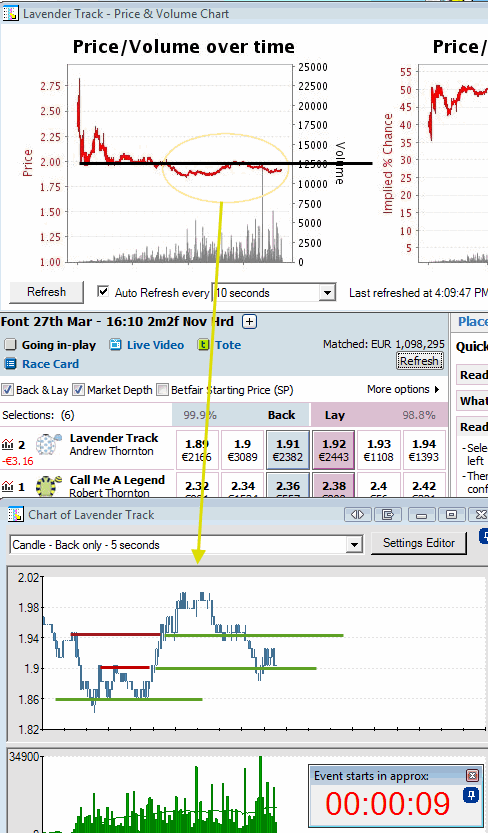
Starting out, Lavender Track was the favorite in the race at 16:10. There was a support level at 2.00 as I have shown in the previous article, which converted into a resistance level afterwards. A part of the original betfair graph is shown in the betfair candlestick chart below, since the drawing of that chart is done in real time and as long as I watch the specific horse race. During the last 10 minutes before the off, there is a down trend up to 1.85 which is instantly defined as the odds support level. In the following minutes the odds retrace to 1.90 which is then defined as the resistance level. The odds are ranging between 1.85 and 1.90, verifying the support level at 1.85 but they break the resistance found at 1.90. At that exact moment it is an excellent opportunity for a profitable trade, taking advantage of the imminent uptrend of course. The red resistance line at 1.90 will be converted into a support line (green) which will be also verified towards the end of the chart. Additionally, the already established resistance line at 1.95 is overcome and has become a support line. However, the odds climbed up to 2.00 where they found the resistance level we had drawn in the main Betfair graph and fell back. At that point it was another good chance to make money trading the downtrend, since it is very rare to break a support or resistance level which is verified in the long term Betfair graph. Backing at 2.00 and laying at 1.95 would secure some profit, while a more risky Betfair trader would have waited and closed his trading position a little lower, towards the next support level found at 1.90. Personally I lost money trading this horse race since the third time the odds touched 1.90 during the first quarter of the chart, I backed the horse with the intention to lay at 1.85, but I picked the wrong time to do it as the resistance was broken. When something like this happens we have to get out as fast as possible. It wasn’t my only trade in that race, but it was the one that cost the most.
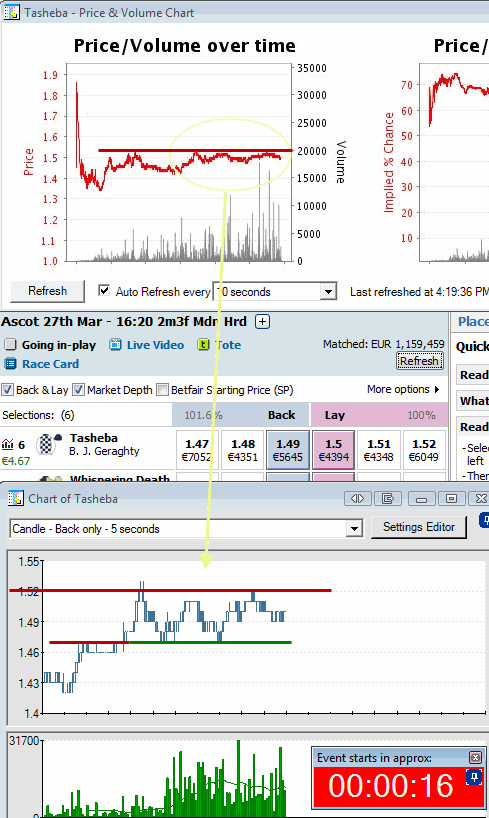
Looking at the charts at 16:20, there is a resistance level in Betfair’s graph at 1.55 or so which is verified in the candlesticks chart below and is never broken. Upon breaking the resistance at 1.47, the odds are ranging between 1.47 and 1.52. By the time the 2 limits are verified, the betfair traders could trade 3 or 4 times between those levels winning 2-3 ticks each time. When most bettors or traders would consider the odds as steady, we would have been able to win 5 to 10 ticks.
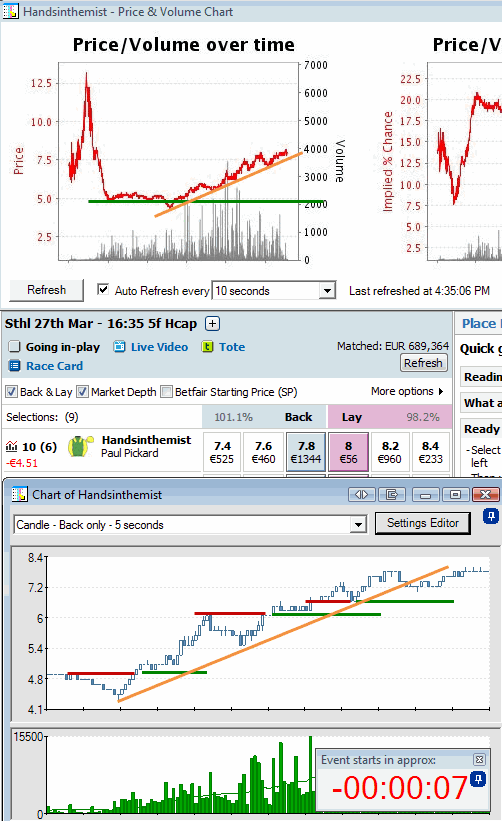
Moving on to the horse race at 16:35, we instantly figure out that we are before a whole different betfair graph. While the odds were “ranging” in the previously mentioned chart, in this race the favorite’s odds are in an obvious uptrend, they are “trending” that is. There are at least 3 levels of resistance that are overcome and become support levels as the odds climb to higher highs, a strong sign of an uptrend. The uptrend is verified by the orange trendline which is drawn if we connect the low peaks. When the odds break this trendline at around 7.20, it is an indication that the trend is most possibly over and the odds will most probably enter a “ranging” phase. Yet the remaining time until the off doesn’t allow more trading, but we were given plenty of trading opportunities. In the specific horse race I backed at 5.00 when the odds reached the resistance level but that wasn’t enough for the odds to bounce back down and as soon as the odds climbed above it, I traded out securing a… loss! A few moments afterwards I was about to lay at 5.50 when the odds retraced to the orange trendling, but family business was calling me and I wouldn’t do any more trading for the day. During the following races I didn’t trade at all but I kept capturing the graphs and odds movements.
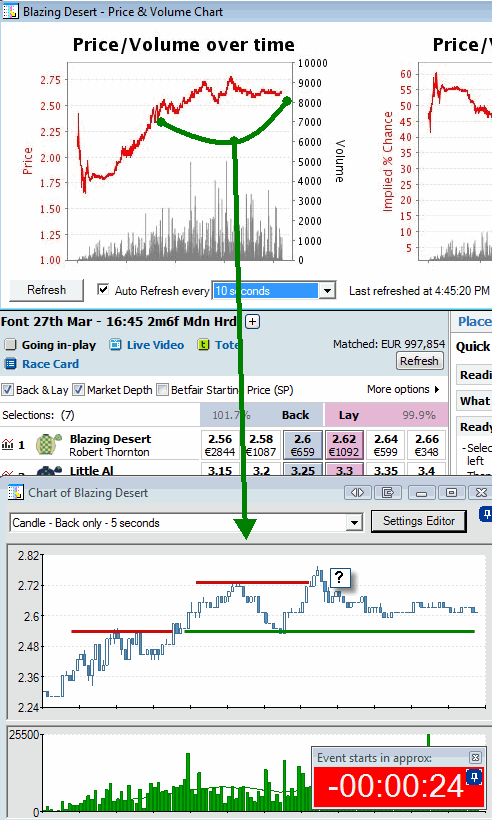
At 16:45 the favorite horse’s odds were in a strong uptrend right from the beginning as the Betfair graph shows, but the trend was gradually losing speed. During the 10 minutes we are interested in, the resistance of 2.50 was broken and become the support (green to red line), which helped us in our future trading. I believe the odds bouncing off that support line offered a great chance for profitable trading by laying first, having already been verified as a resistance level during the uptrend. On the other hand, I also believe there was a trap at 2.74 when the resistance line was broken for just 2 ticks but the odds didn’t move any higher than that. That formation alone was a major indication that the uptrend had ended. That odds movement reveal a last attempt made by layers to move the odds even higher, but they were unable to do so due to the backers’ orders.
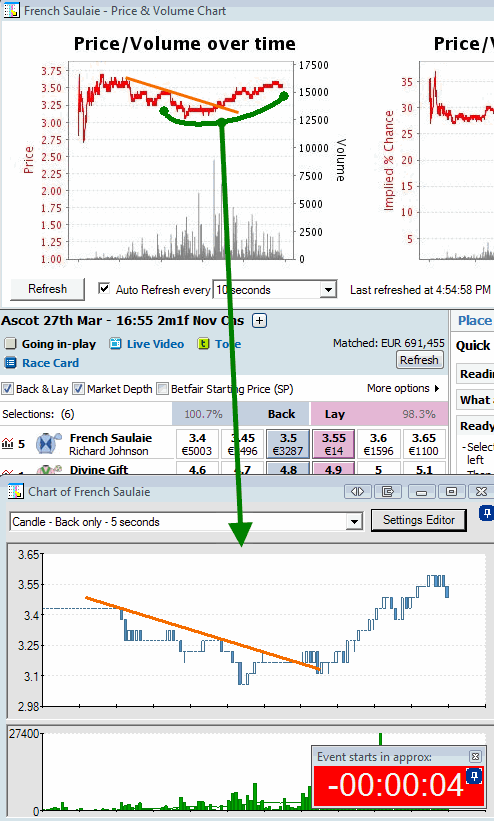
Finally, at 16:55 there was a downtrend which is verified by the trendline created if we connect the higher peaks of the odds movement. As we already saw in a previous chart, when the odds break the trendline, the trend is no longer valid. In this instance a new trend was formed which led the odds back where they began from. I would say that the fair odds were found there but due to some events, many backers were convinced that there was value at those betting odds. However the market corrected that possible anomaly and retraced the odds back to the original price. As a good trade I would consider backing at 3.25 during the downtrend and exiting at 3.15, while we could also enter the forthcoming uptrend when the odds broke the trendline, by laying at 3.20 and backing at 3.45 or so.
So, we examined 5 horse race more applying technical analysis and using candlestick charts with much more detail. Although we haven’t talked about their advantages, we proved that they provide a lot more information in their formations, which can lead in better trading predictions in Betfair. For yet another article we commented on the basic principles of technical analysis such as trendlines, support and resistance levels and I firmly believe that they should be considered as a big help in predicting the odds movements in Betfair. Next time I’ll be focusing more in the candlesticks charts and formations that the Bet Angel trading platform offers to Betfair traders.