How betting charts help me win by beating the closing odds
Let me briefly tell you the story that led to this post.
I follow @domcortis at Twitter for his insightful and scientific approach to sports betting. A retweet by him today referred to Sunday’s Arsenal-Leicester clash. Not such a big deal, if it weren’t for the link citing GitHub!
What is GitHub?
GitHub is where people build software, as you can find out if you Google it. It’s a website where programmers contribute to millions of projects and help each other. Think of computer code, a lot of code. So, I took a peek.
Turns out the link featured a page for non-tech savvy people. In fact, it’s an article like the rest, although there are some very interesting charts in there. And you know how much I love charts!
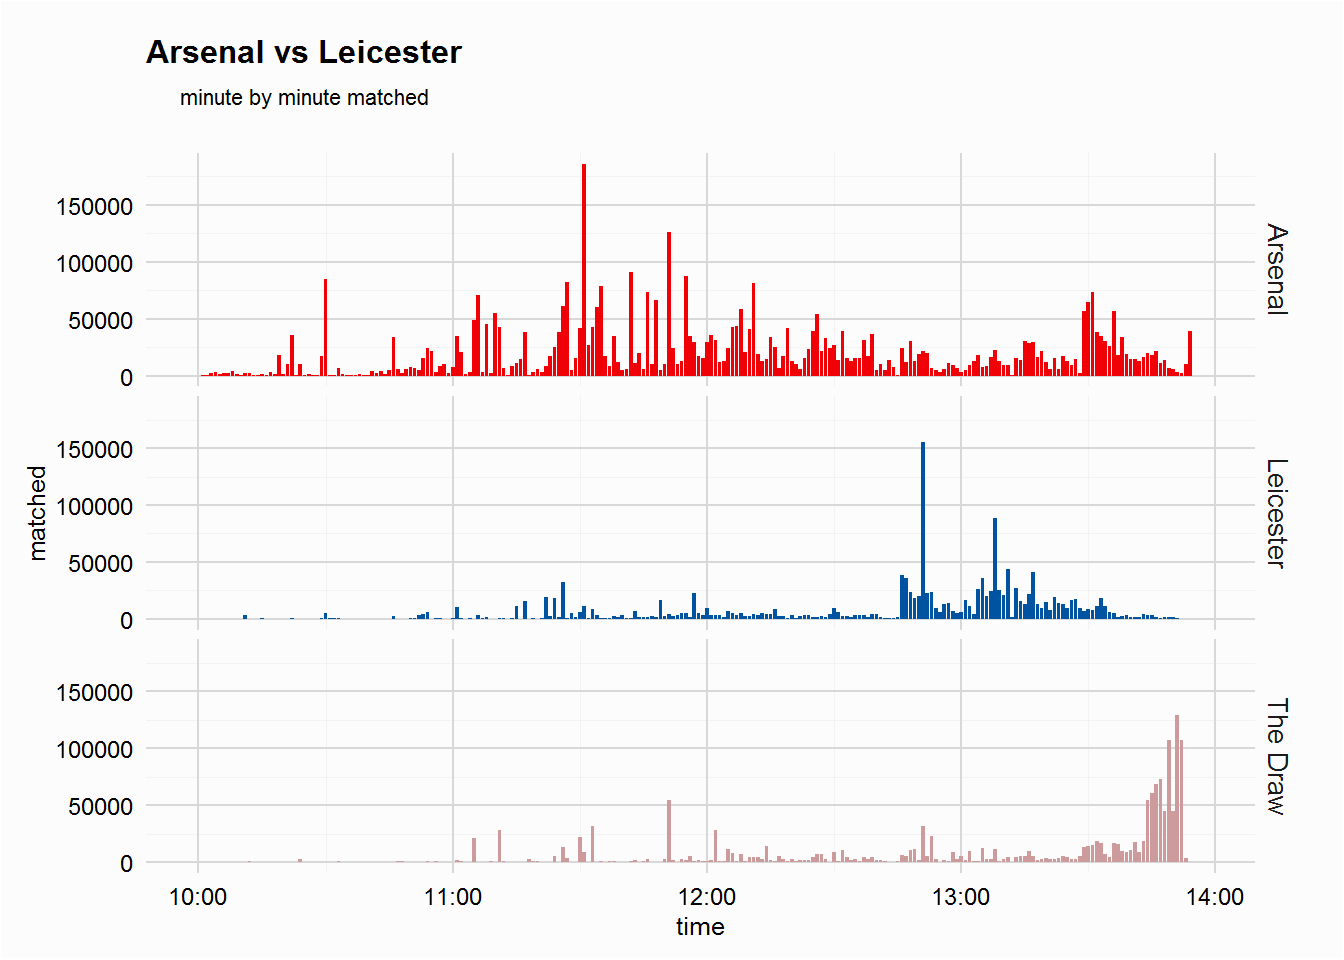
The project is about collecting Betfair data over time aiming to build betting models and establish trading strategies, as Tom @UTVilla mentions in the cron job. As a result, they kept track of two Premier League games, which we will quickly analyze below, focusing on market efficiency.
Now, on to the juicy stuff.
This morning PinnacleSports tweeted an old post about market efficiency. I read it, liked it and shared it with my friends (known as followers at social media). It’s about how sportsbooks’ closing line is more accurate than opening odds in predicting the probability of how a fixture will play out.
In plain words, if you bet on odds that declined afterwards, you did the right thing. According to the popular bookmaker, “a consistent track record of beating the closing odds is, therefore, an indicator of consistent profits in the long run.” Market efficiency is a hot topic of mine that I regularly go back to.
Let’s now take a closer look at the two GitHub’s charts. First, Arsenal vs Leicester (FT: 2-1):
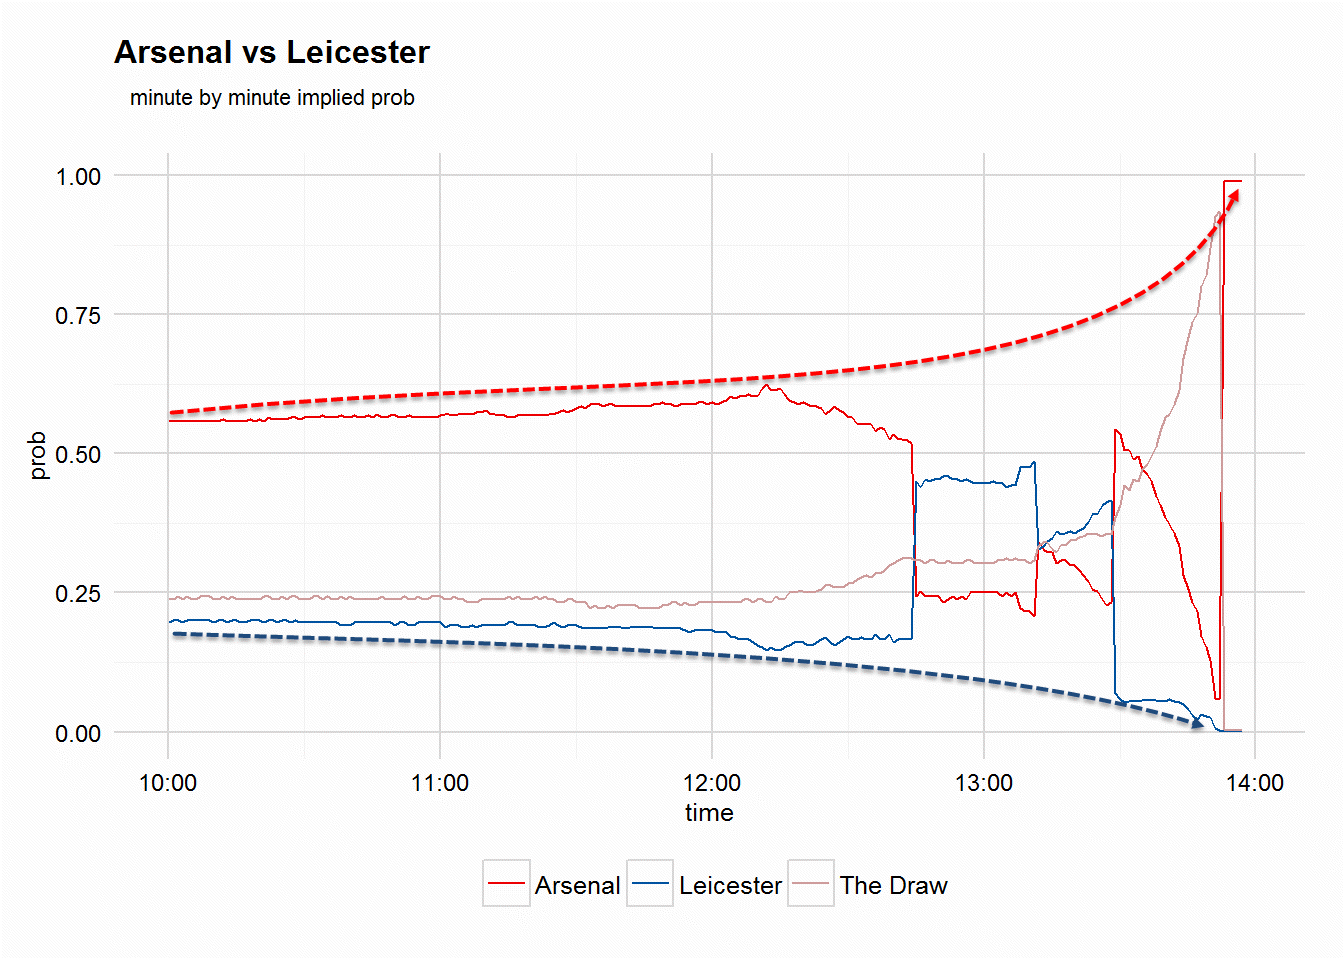
The charts show the implied probability, thus, an ascending line means odds declining.
The dotted lines/arrows are mine. Notice how the preceding betting trend hinted the way to the game’s outcome, despite the ups and downs of actual play that began after kick-off time (12 PM).
The same pattern is evident for the home team in Manchester City vs Tottenham chart (FT: 1-2). Yes, draw odds were drifting a bit but in general, we should ignore the price action of the draw’s line unless it shortens quite a lot (think of 3.30 shortening to 2.50 or lower).
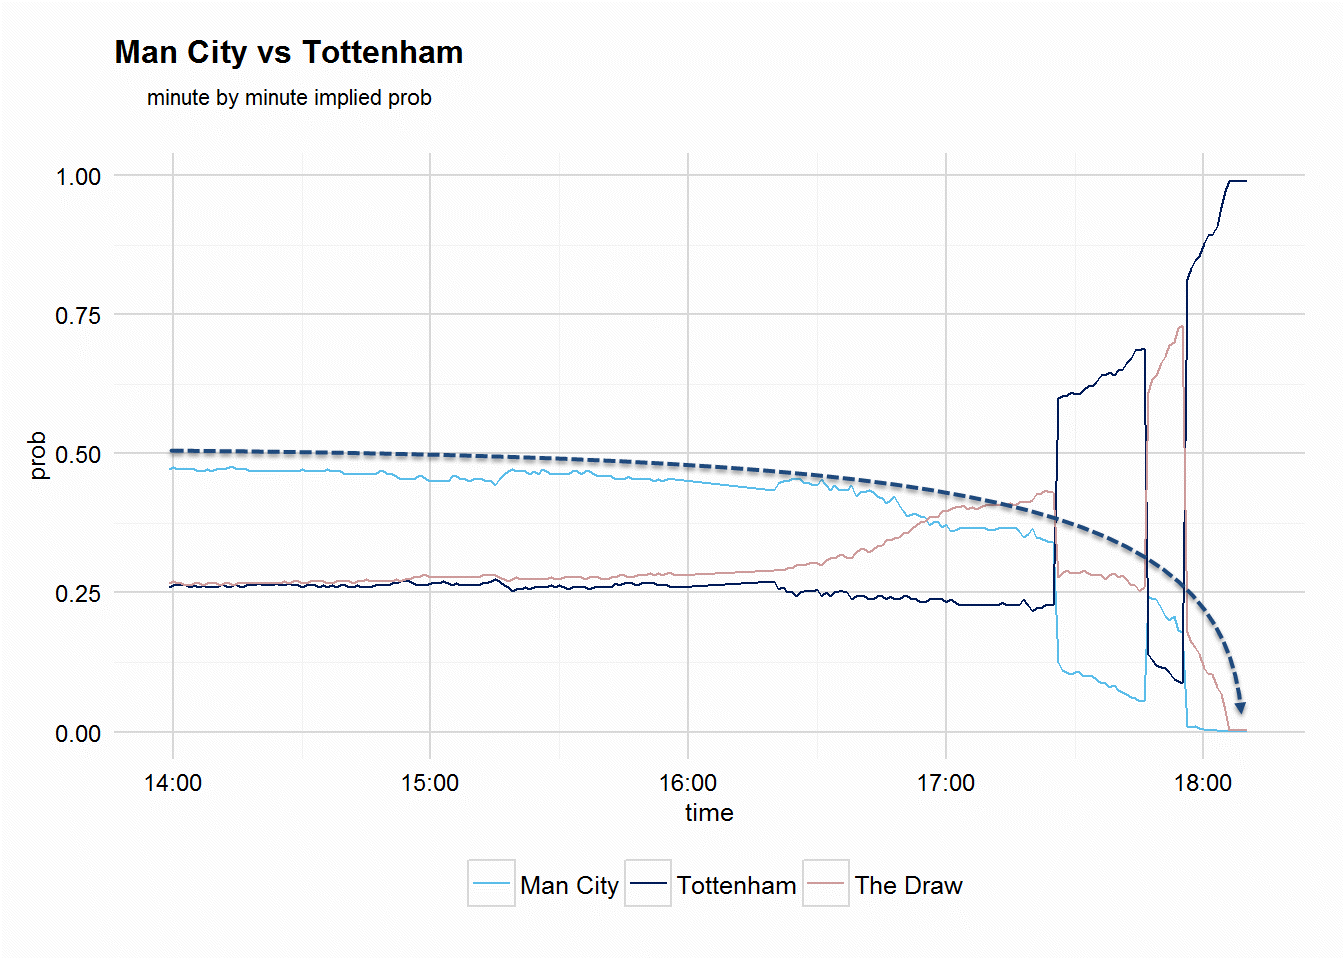
Of course, those are merely two examples of countless football games that take place in a regular season. It doesn’t mean that every time you see odds declining, the team will win. Far from it. We are all estimating here. It eventually comes down to who makes the best estimates.
Now that we know for a fact (thank you Pinnacle) that closing odds are more efficient than opening odds, we need to be competent and quick enough to spot these downtrends. That is why you will find me talking about dropping odds in the articles I have published online since… the beginning of time!
I may not know which odds will drop before they begin shortening. But I will certainly help you find the ones that have started falling. Combined with basic chart analysis, I often answer the next important question:
Will the declining odds shorten more before the kick-off time, or are they bottoming?
Because, if you bet on shortened odds that didn’t decline further, I’m afraid you just made the gaming operator richer.
Member discussion