

Using as a reference the races taking place in Ascot these days, we will examine the fixed odds’ charts regarding technical analysis, which is widely spread in the financial markets.
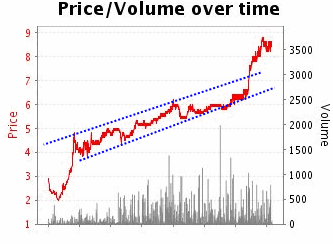
Cockney Rebel was the favorite in the 3.45 race at odds of 2.20. 10 minutes before the start of the race the chart was like this:
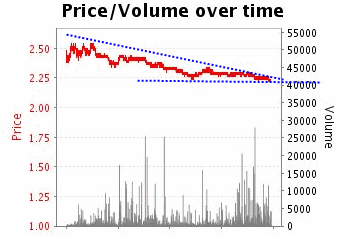
The volume traded was about 2,000,000€ (yes, million) and judging by the chart, we could conclude that we would witness an accelaration of the downtrend at 2.20, where the blue lines collude, or violent reverse action. We weren’t sure and we would do something invaluable which many usually forget. PATIENCE!
Eventually the odds fell even more and big bets were placed. Let’s see how things evolved:
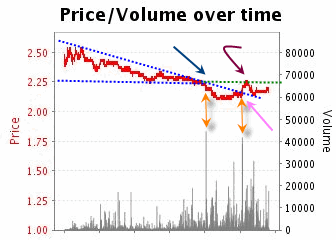
We can see that at that 2.20 spot, a 40,000€ bet was placed forcing the odds even lower. Big volume increase (mainly the mean price of it) with simultaenous sudden price rise or fall, is everything in technical analysis. So, at that point we back the horse and wait. After a while, we witness an inactivity period and here I’d advise closing our positions when we see this inactivity to avoid unpleasant conditions. Indeed, and while the inactivity was accompanied by volume increase (tha bottom vertical lines get bigger as time goes by) – a bad sign for our position, it means the price is pushed but the trend has stopped – a big bet came and corrected the price leading it up (yellow arrows). It would have been a good choice if we had gone out earlier or at that exact moment. However, the price wouldn’t climb over 2.20 (blue line which turns into green) and in fact we verify a peak at the purple arrow which ends the uptrend correction.
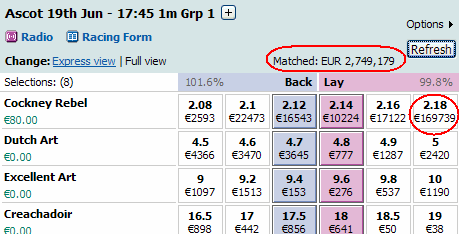
During the last 10 minutes prior to the race’s start, big amounts of money appeared as the following picture shows. While the other offers are around 10-20,000€, there is 170,000€ for sale (back) at 2.18! In comparison with the total volume (2,7mil €) it is an enormous amount and the biggest proof that it is a bet that doesn’t want to be matched, but rather wants to push the market downward. This phenomenon is called “spoofing”.
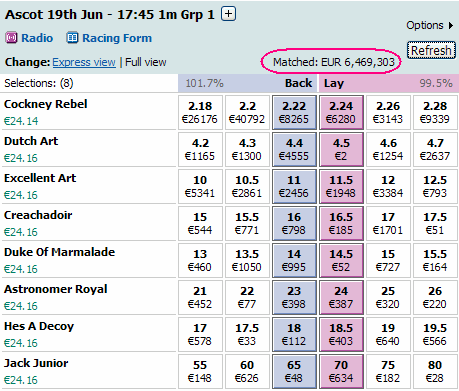
A couple of seconds before the start, things were like the image shows. Oh yes, 4 million euros in 5-7 minutes in just a horse race. No comments.
Let’s see one more example. A bit earlier at the Thirsk 3.30 race, 5 minutes before the start, Trees of Green was trading like this:
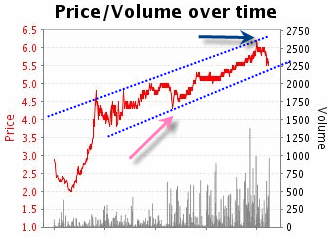
A rather good choice would be to lay at the pink arrow (4.50) and back at the blue one (6.0). However, take a look what happened 1 minute before the start of the race.
Starting from 6.0 it reached 8.8, and if we think how much we would have won if we traded like before but without closing at 6.0, we would consider if technical analysis is meaningful after all.
Still, notice the simultaneous volume increase (usual fact in betfair, where the bets are increased constantly while we approach the start of the events, not just the horse racing but the rest as well).
The article was published at Betfairinfo.gr.