

Technical analysis can be applied in Betfair betting markets and many Betfair traders make money trading with it. Here are the Betfair charts of the favorite horses of 6 horse racing betfair markets which took place yesterday. Besides the odds movement, I have added to the Betfair graphs some technical analysis’ elements, mainly trendlines, support and resistance levels. In that way I can discuss how to apply technical analysis in Betfair showing real examples.
Learn about Betfair trading and read the latest news about sports trading in my new trading blog!
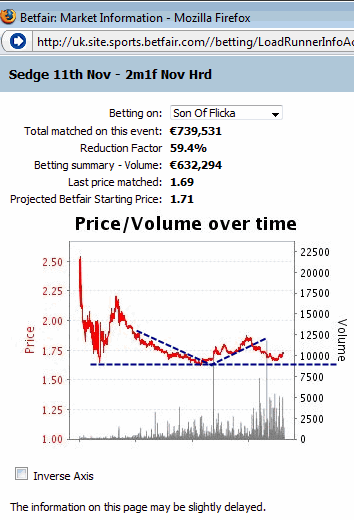
We start with the race of 12:50. Son of Flicka initially had a downward trend moving its’ odds from 2.00 to 1.75. At that point the odds “bounced” and we could easily see that, since the odds broke the blue dashed line that was defined by the previous highs. In the same way we draw the trendline that shows the forthcoming upward trend by connecting the previous lows. Additionally, 1.75 will be the support level, which if we look closely, the odds have bounced off in the beginning of trading. All those defining peaks in a Betfair graph obviously are very important in technical analysis.
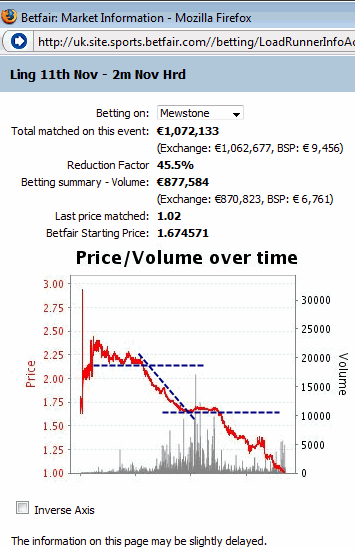
At the 13:00 race the Betfair chart shows the odds movement even after the start of the race just a few seconds before the horses cross the finish line. In the beginning of the graph the odds have met support at about 2.20 and they find it difficult to fall below it, although the highs are getting shorter and shorter. That is a major indication that there will be a strong trend as soon as the support level is broken. Indeed, the odds movement proves that and the odds reach 1.65 in just 2 minutes’ time and all that BEFORE the horse race starts. That happened when the support level at 1.65 was broken. If you ask me whether we can apply technical analysis in trading in-play horse racing markets I won’t answer that now. But if you dare try it and you are quite fast in trading, you might succeed.
At 13:20 we had a very interesting graph with a lot of opportunities for profitable and probably easy trading. In this chart we can understand when a trendline accelerates. Notice the first blue line which bends upward when we connect the lows of the odds; an indication that not only a trend has been established, but it will speed up. That is the case, since in a couple of seconds the odds skyrocketed from 4.70 to 6.60! In the following minutes the odds move inside a “tunnel” that is defined by the support and resistance levels.
In the next Betfair chart we can see that when a resistance level is broken, it will be most probably converted into a support level. Notice the first blue horizontal line. That is a difficult graph to use for trading afterwards, since while the trend is facing down and the support level is broken, the odds move suddenly back up. If we had applied a stop loss, we could minimize our losses. However, if we had defined a stop loss at the resistance level, we would have caught the downward trend, since the resistance level was not broken. At this point I should point out that usually we don’t take into account the sudden peaks above or below the resistance or support lines.
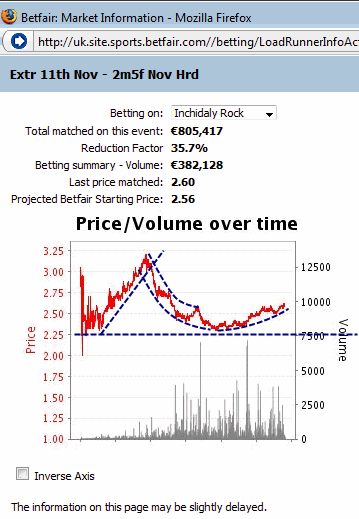
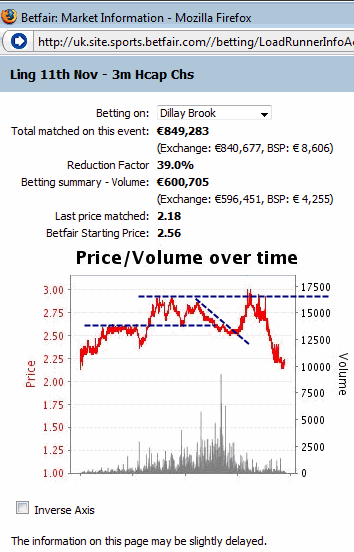
At 13:40 there was a steady upward trend defined by the trendline connecting the lows, which reverted and the following downfall would lose speed according to the trendlines. We should also see that the support level at 2.25 never broke.
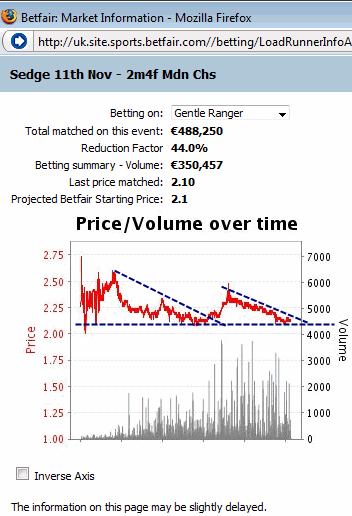
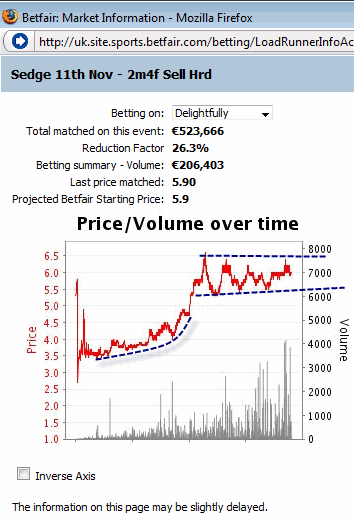
In the last betfair chart showing the odds of the 15:50 race I would say it was a difficult race to trade the favorite. Although the support level is more than obvious, it would be impossible to notice the first downward trend without a major indication, while the second trend was also not so apparent. On the other hand, since the odds started falling again from 2.40, it could have been a good opportunity to back and close our trading position at the support level.
You can see how technical analysis applies in real-time by watching the following trading videos: