

The bullish reversal candlestick patterns are important formations in technical analysis and help to identify changes in direction of price action. According to their reliability they are divided among three categories but most of them require bullish confirmation and an existing downtrend. Of course, other aspects of technical analysis should be used besides candlesticks for better results. Most importantly though a candlestick reversal pattern does not necessarily suggest a complete reversal in trend, but rather a pause in direction or sideways trading.
High Reliability
Morning Doji Star

In a downtrend, the market bolsters the bearish trend with a long black day and gaps open on the second day. However, the second day trades within a small range and closes at or near its open. This scenario generally shows the potential for a rally, as many positions have been changed. Confirmation of the trend reversal is given by the white third day.
Bullish Engulfing Pattern

This pattern must occur after a signifcant downtrend. It occurs when a small bearish candle is engulfed by a large bullish candle. This signals a possible reversal. Ignore the wicks. An even stronger signal occurs when the bullish candle engulfs the bodies of two or three previous candles.
Three White Soldiers
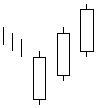
With this pattern, there will be three long white days in a downward trend; each day will close at consecutively higher rates. This usually reflects fortitude in the future market, since a trend reversal is in progress that is building on moderate increases in the market. This bullish trend offers a high reliability rate.
Piercing Line

In a downtrend the market gaps open, but rallies strong to close above the previous days midpoint. This pattern suggests an opportunity for the bulls to enter the market and support the trend reversal. The Piercing Line pattern is the opposite of the Dark Cloud Cover.
Kicking
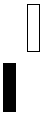
This Bullish Kicking Pattern is a strong sign showing that the market is headed upward. The previous market direction is not important for this pattern unlike most other candle patterns. The market is headed up with the Bullish Kicking Pattern as the prices gap up the next day. The prices never enter into the previous day’s range. Instead they close with another gap.
Abandoned Baby

A reversal pattern characterized by a gap followed by a Doji, which is then followed by another gap in the opposite direction. The shadows on the Doji must completely gap below or above the shadows of the first and third candle.
Morning Star
In a downtrend, the market bolsters the bearish trend with a long black day and gaps open on the second day. However, the second day trades within a small range and closes at or near its open. This scenario generally shows the potential for a rally, as many positions have been changed. Confirmation of the trend reversal is given by the white third day.
Moderate Reliability
Dragonfly Doji

The market is in an overall bearish mood characterized by a downtrend. Then market opens and sells off sharply. However, the sell-off is suddenly abated and the prices reverse direction and start going up for the rest of the day closing at or near the day’s high thus leading to the long lower shadow. The failure of the market to continue in the selling side reduces the bearish sentiment. Now the shorts are increasingly uneasy with their bearish positions. If the market opens higher next day, many shorts will have a strong incentive to cover their short positions.
Long legged Doji

Long Legged Doji shows that there is a great deal of confusion and indecision in the market. This particular pattern shows that the prices moved well above and below the day’s opening level, however they finally closed virtually at the same level with the opening price. The end result is only a little change from the opening price despite the whole volatility and excitement during the day that clearly reflects that the market lost its sense of direction.
Gravestone Doji

The market opens below the closing price of the previous day. Then there is a brief rally but the rally is not enough to send prices over the closing price of previous day and prices then reverse direction and fall down to the day’s lows. This movement however leaves shorts in a losing position creating the potential for an upcoming rally. It may not be clear why it signals a potential reversal. The answer has to do with what happens over the next session. If the next day opens above the real body of the Gravestone Doji, it means those who shorted at the opening (or closing) of the Gravestone day are losing money. The longer the market holds above Gravestone Doji’s real body the more likely these shorts will cover. The short will then spark a rally by covering their positions, which also encourage the bottom pickers to go long. The Gravestone Doji represents the graves of those bears that have died defending their territory.
Doji Star

Usually a star that follows a long black candlestick in a downtrend indicates a change in the market environment. Bears were in control during the downtrend but now a change is implied by the appearance of a star that shows that the bulls and the bears are in equilibrium. The downward energy is dissipating. Things are not favorable for continuation of a bear market.
In a downtrend, the market bolsters the bears with a long black day and gaps open on the second day. However, the second day trades within a small range and closes at or near its open. This scenario generally shows the potential for a rally, as many positions have been changed. Confirmation of the trend reversal would be a higher open on the next trading day.
Harami Cross

After a long black day at the low end of a downtrend, the market opens higher than the previous day’s close and closes at the open. The Harami Cross indicator is more definite than the basic Harami indcator, and signifies a reversal for the bulls.
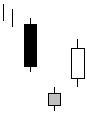
Matching Low

Market continues to move down as evidenced by first black candlestick. Next day; prices open at a higher level, they then continue to go up during the day but the day closes at a price which is equal to the closing price of the previous day. This pattern suggests a short-term support. Shorts should be aware of this fact. If they ignore Bullish Matching Low Pattern as a possible reversal signal, they may pay for it soon. Two days closing at the same price is indicative of short-term support and this support may be followed by a reversal on the next day of trading.
Tri Star

In the case of a Bullish Tri Star Pattern, we have a market, which is in a downtrend for a long time. However the weakening trend shows itself by the fact that the real bodies are probably becoming smaller. The first Doji is a matter of concern. The second Doji clearly indicates that market is losing its direction. Finally, the third Doji warns that the downtrend is over. This pattern indicates too much indecision leading to reversal of positions.
Low Reliability
Harami Pattern

When a long black day occurs at the ending of a downward trend, a white candlestick will open that is higher than what the previous day closed at. Prices will rise and many shorts are covered, this will encourage even more investors to buy. This pattern is usually confirmed when the next trading day’s candlestick follows the reversal trend.
Hammer

Hammer candlesticks form when prices moves significantly lower after the open, but rallies to close well above the intracandle low. The resulting candlestick looks like a square lollipop with a long stick. A hammer indicates that the market may be attempting to find a bottom, and that buyers are strengthening their position. The hammer is the opposite of a hanging man.
Inverted Hammer

An Inverted Hammer indicates that the prior downtrend is about to end and may reverse to an uptrend or move sideways. The Real Body of the Inverted Hammer should “gap” away from the Real Body of the previous session. The greater the size of that gap the more important the Inverted Hammer. The Upper Shadow of the Inverted Hammer should be as large as possible. The larger the Upper Shadow, the more important the Inverted Hammer. The Inverted Hammer is the same as an Shooting Star, only the Inverted Hammer appears at the end of an downtrend, whereas the Shooting Star appears at the end of an uptrend.
Belt Hold

The bullish belt hold often signals a reverse in investor sentiment from bearish to bullish. Since this trend occurs frequently but is often incorrect in predicting future share prices, it is rarely perceived to be useful. As with any other candlestick charting patterns, more than just two days of trading should be considered when making predictions about trends.
