

‘Greek crisis’. ‘Grexit’. ‘Greek economy in turmoil’. It’s that time of the year; again. So, I thought to take a quick look at the crisis’ benchmark, the usual suspect: the 10-year Greek bond.
A few notes for those unfamiliar of bonds and charts:
- A rise equals to rising chance for default.
- A fall equals to decreasing chance for default.
- That’s about it.
With that said, here’s the daily chart for the last 12 months:
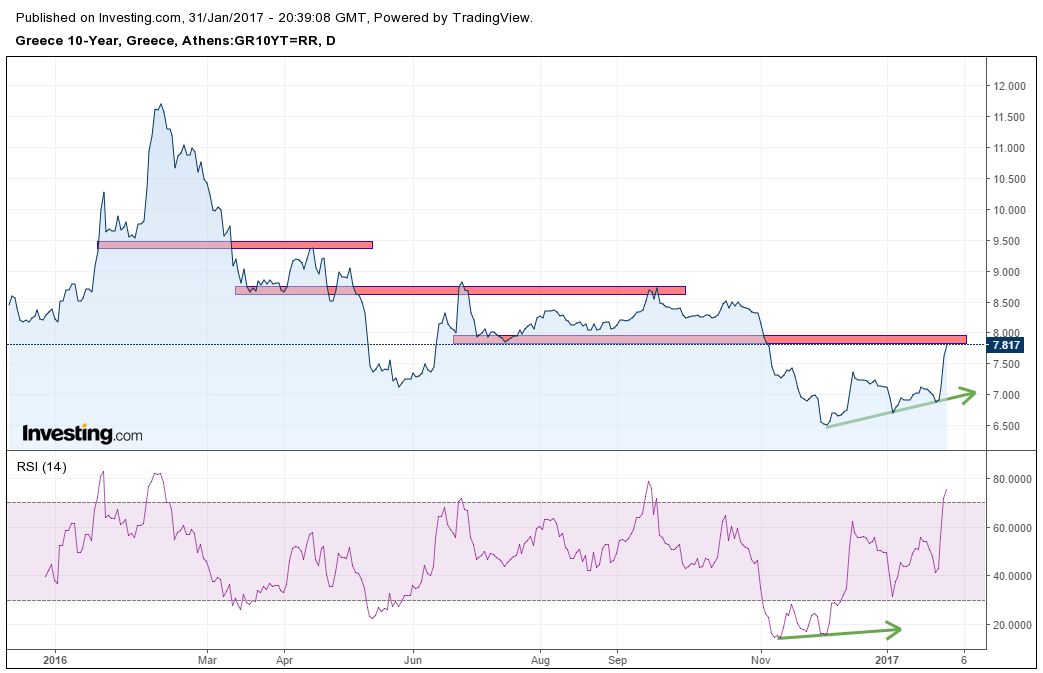
Starting off from 2016 and since its yearly high, the bond has been declining. It has dropped from 11.50 basis points to 6.50 in December. Great. That means Greece’s chance of defaulting has been significantly diminishing over the course of twelve months.
Now, a few things about the drawings on the chart:
- The red areas indicate ranges that the bond price found support. When that support failed, we notice that it acted as resistance for every attempt to climb, such as in April, June and September.
- Since November, the 10-year Greek bond has been trending upwards. Note the higher lows that help drawing the ascending trend line.
- It’s now trading very close to the previous support. So, the recent upside will meet resistance most likely. Remember, it’s all about probabilities. We cannot be certain, it’s just more likely to drop than continue ascending.
- Bottom part: Back in November the RSI indicator was into oversold territory. What’s more, it failed to print new lows and it actually began trending upwards (green arrow) while bond was still printing new lows. That’s called divergence and usually, it is considered a leading one, meaning the price should follow up. In fact, that’s what it did the past two months. Let me remind you the cycle before we jump to conclusions of a full reversal: trend-consolidation-new trend.
Before we sum it up, here’s the weekly chart to put everything in perspective.
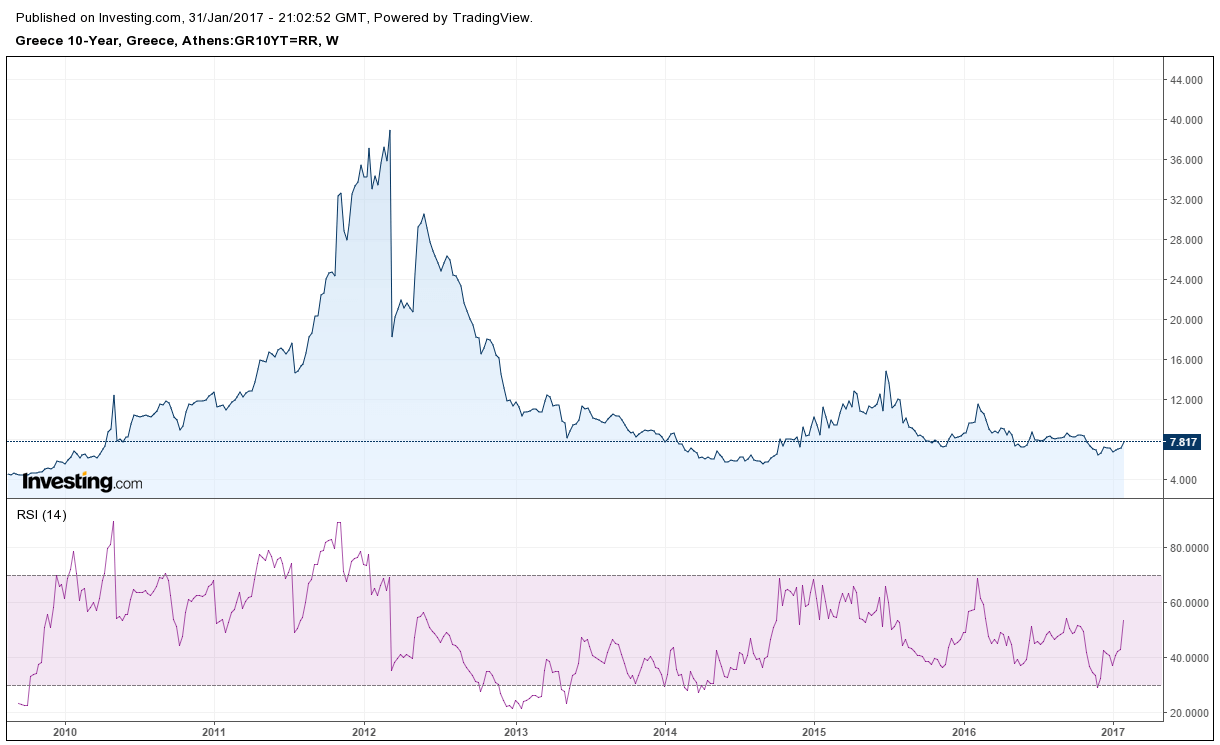
For the time being, I expect the short-term uptrend to reverse and the long-term decline to resume. As long as the bond stays inside the 6.50-8.00 range, I wouldn’t worry of the news’ fearmongering headlines. Should the 10-year bond go for a retest of 8.70 resistance level, I might be a bit alarmed. If it shoots above 9.00, the hype is real, although the bond had hit 15.0bps in 2015 when the new government was established.
Maybe a similar surge could mean elections once again.
Featured photo: Matt Trommer/Shutterstock
