

Today, I want to share a little story with you.
It's about a puzzle I've been trying to solve on my business' most crucial website. This website keeps the lights of my business on.
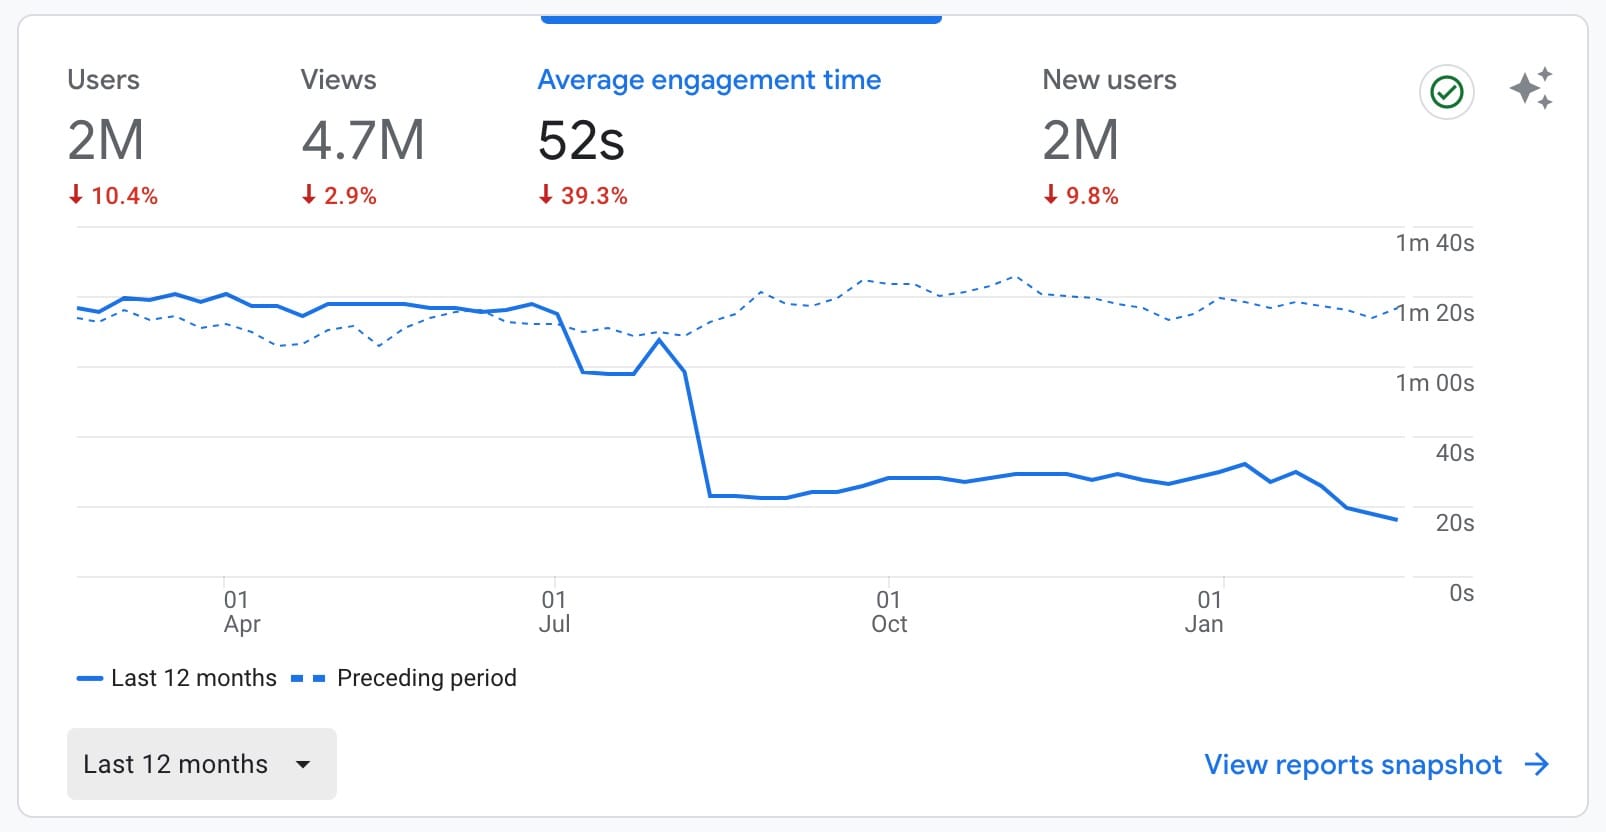
You see, not too long ago, I noticed something worrying. The time people spent on that site started to drop.
How did I notice? The average engagement time has been dropping like a stone in the Google Analytics data.
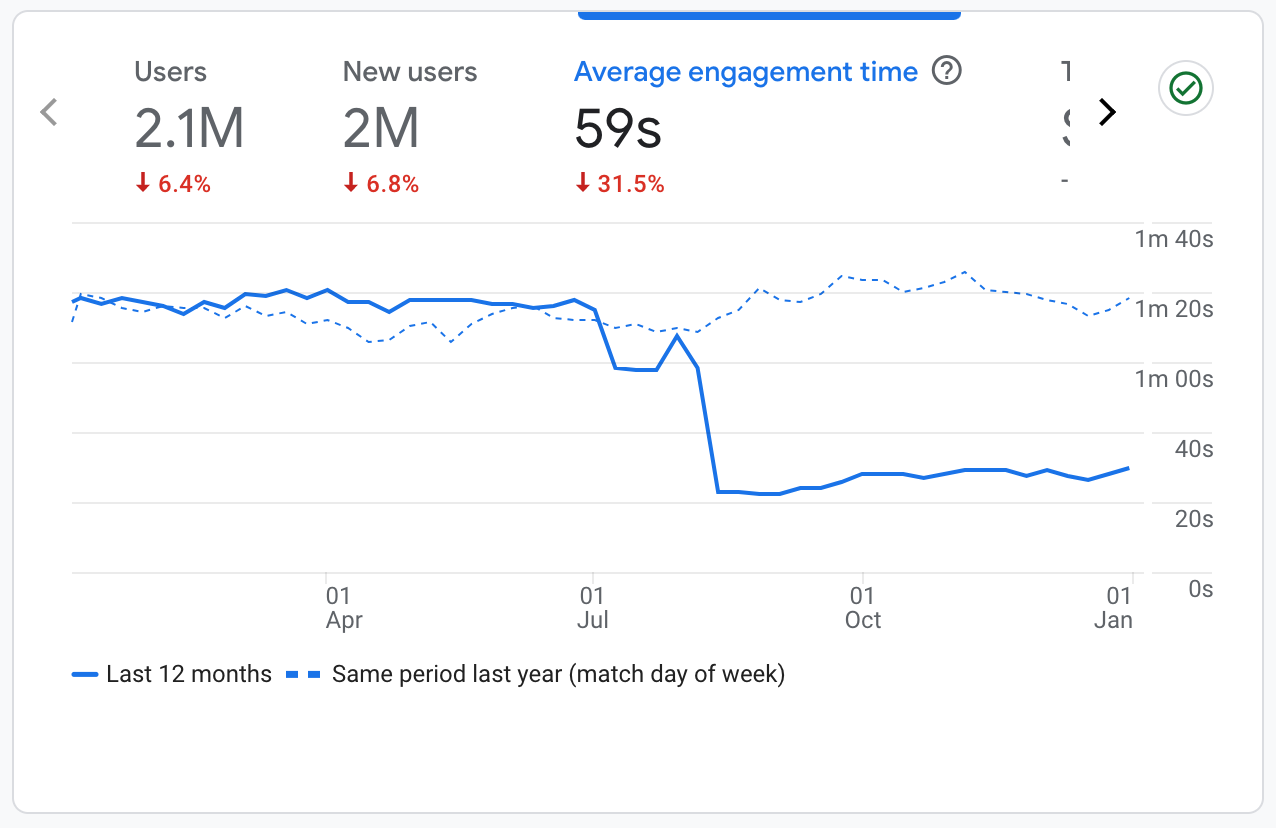
This happened around summer, and it made me scratch my head in confusion.
Imagine inviting friends over and noticing they don't stay as long as they used to. You'd wonder what changed, right? But my website was running like a clockwork for years. Nothing had changed all this time.
So, when people started spending less time on it out of the blue, I knew I had to find out why.
Solving the Average Engagement Time Drop Together
I wore my web development hat and started my detective work by visiting Reddit. Reddit is like a giant library where people talk about everything. And I mean everything!
My first thought was Google Analytics had messed up. Many website owners had to migrate to Google Analytics 4 (GA4 for short) to track their traffic in the summer. Maybe that was the culprit. It could have been a bug in reporting.
So, I jumped into the subreddit on Google Analytics.
I found three discussions where people talked about the same problem I was having. They shared their thoughts and what they tried to fix it.
While diving deep into the Reddit rabbit hole, I stumbled upon a post that caught my eye.
One fellow web wanderer shared their experience. Their average engagement time had taken a nosedive. It dropped from 1 minute 40 seconds to about 30 seconds in mid-August.
He hadn't changed anything and had kept adding and editing content. Yet, it was as if everyone decided their content was as interesting as watching paint dry.
That felt very relatable.
Then, another Redditor chimed in like a plot twist in a mystery novel. They have had the exact same problem on two sites since August 10th.
It felt like we were all part of a club nobody wanted to join - the 'Now what?' club.
A fellow website owner shared their baffling experience in another intriguing Reddit post. Their site saw its average engagement time plummet from a solid minute to 10 seconds in early August.
Scary, right?
This sudden drop turned into a persistent challenge, with their traffic taking a hit. They've tried every trick in the book, earning scores in SEO tools like Semrush and Ahrefs. They even shine in Google's Lighthouse report for site performance.
Yet, the mystery of the disappearing engagement remains unsolved for them. They continue to seek advice and share their story in hopes of finding a lifeline.
A Spark of Hope in Fixing Average Engagement Time
One idea in a comment caught my attention in another discussion.
Someone suggested that the problem might be with Google Ads.
Google Ads is a tool that shows advertisements on websites. I had connected it to Google Analytics when I launched the website over a decade ago.
Since I've partnered with big advertisers as the site grew, I quit using Google Ads. But the link was still there.
The advice was to disconnect Google Ads from Google Analytics. By doing so, the average engagement time would return to previous levels.
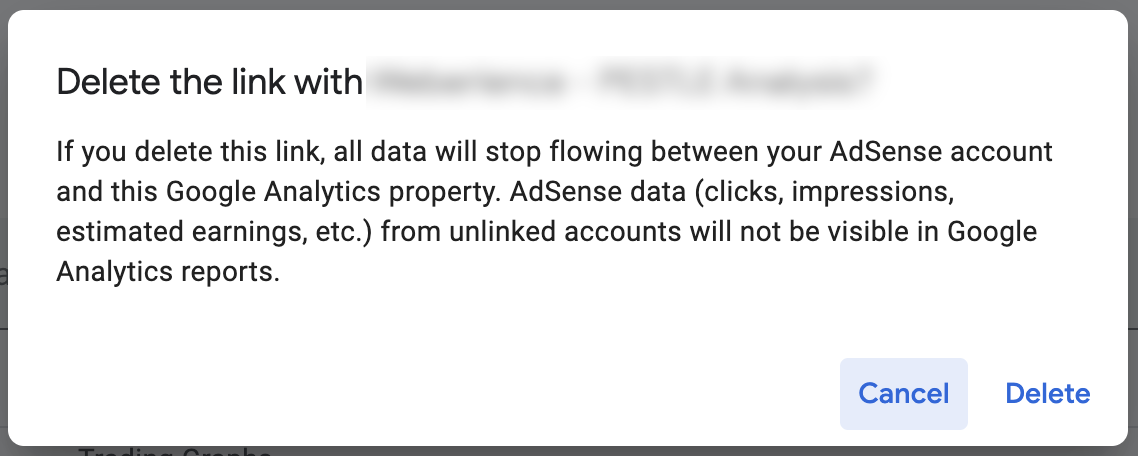
They thought this connection was causing trouble. It made it look like people were leaving my site sooner than they actually were. In effect, Google Analytics seemed to have trouble interpreting visitors' actions.
I thought, "Why not?" and decided to give it a try.
I went through the process of unlinking them with this help guide by Google.
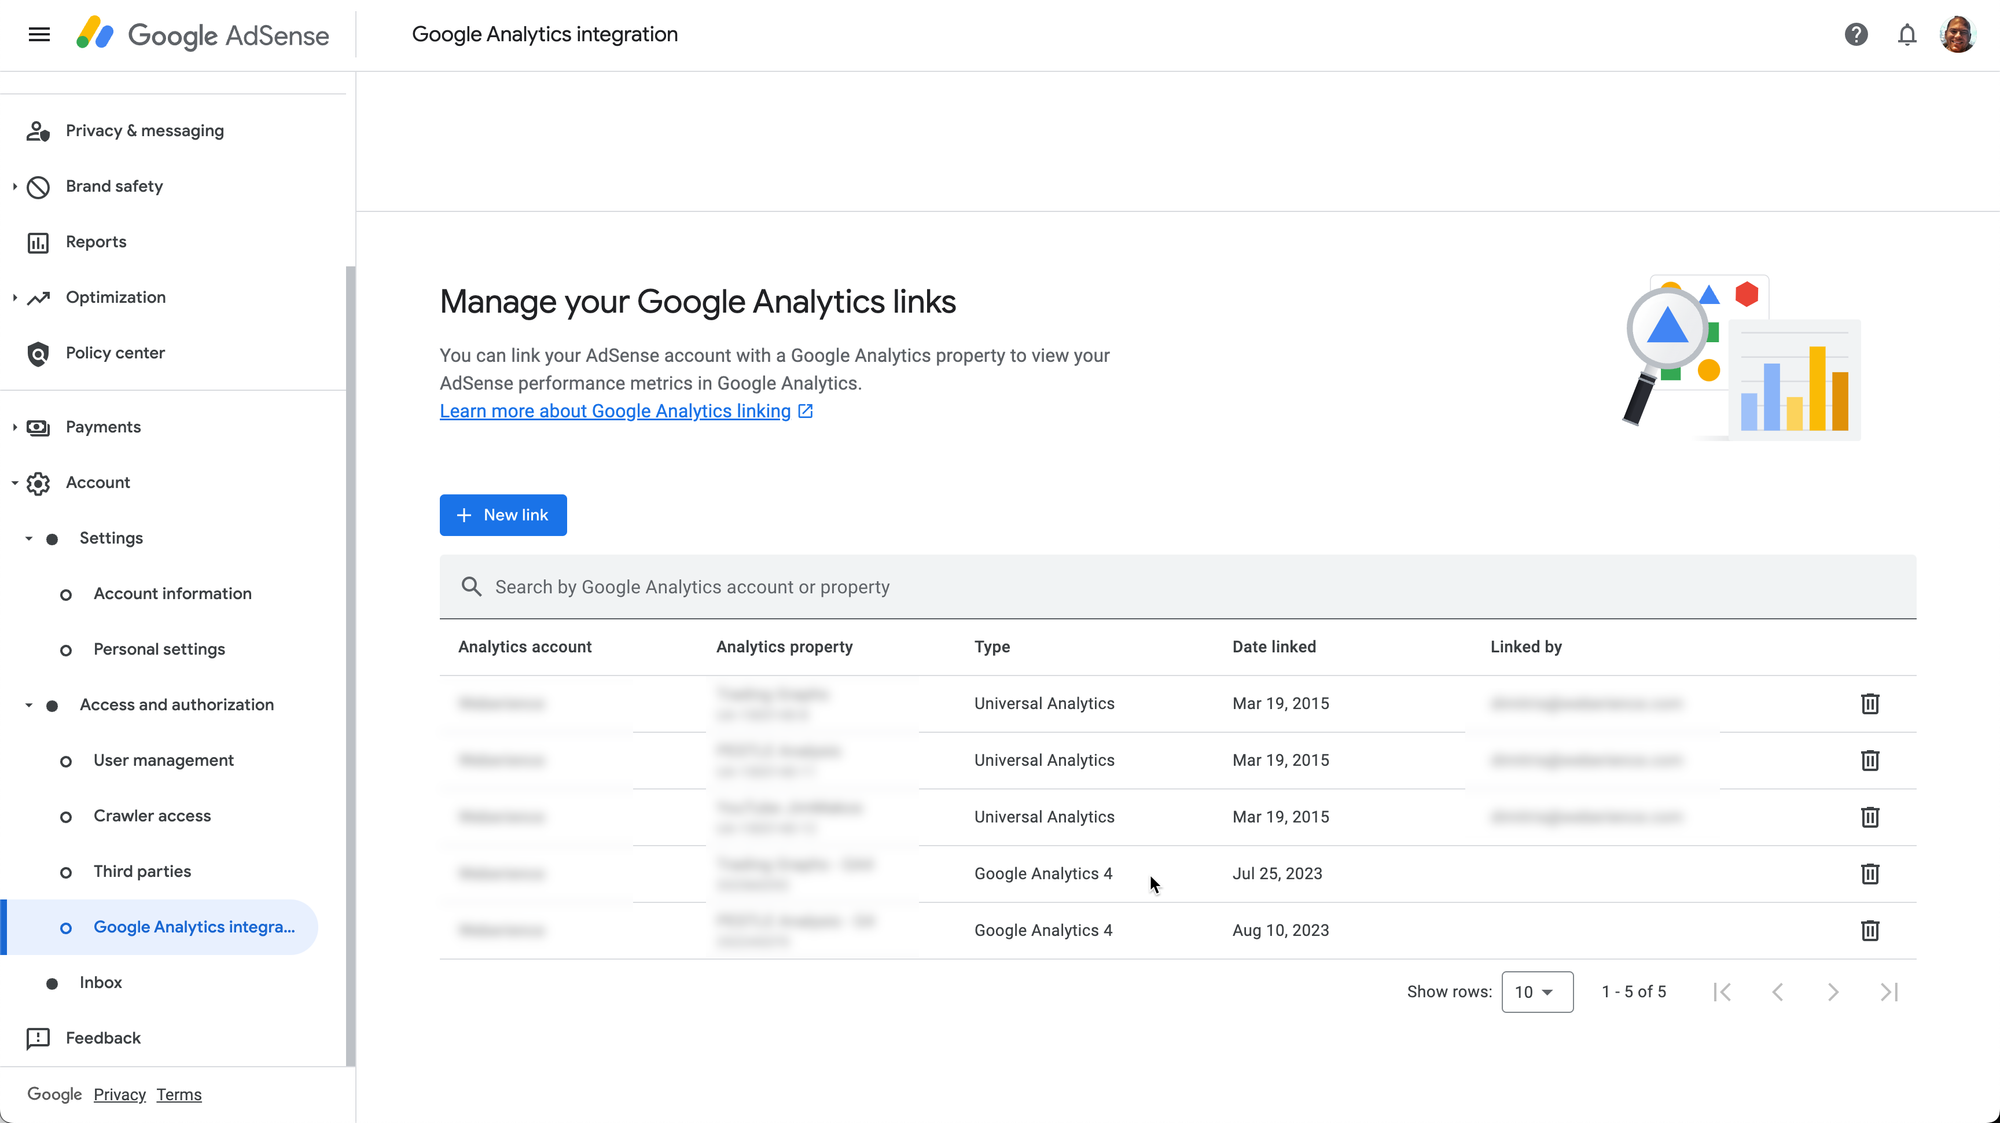
After I did that, I waited to see if it worked. It's one of those changes that you can see the results on the next day. A rare phenomenon in the web publishing world, I must say!
Still, it felt like waiting for water to boil. You know it's going to happen, but it feels like it takes forever.
The next day, I checked the Google Analytics data.
The change didn't do the trick.
People were still spending less time on my site. And average engagement time continues to be bad to this day.
Still Hunting for the Average Engagement Time Fix
So, here I am, still on the lookout for a solution. It's like being a detective in a mystery story, except the clues are numbers, and the suspects are tech issues.
I've learned a lot along the way, though. After all, every problem is a chance to learn something new.
I'm not giving up, obviously. This website is too important to me. My family's livelihood depends on it. That's a certain clue that we should not rely on a single income stream.
I'll keep looking for answers, trying new things, and asking for advice. Who knows? Maybe the next thing I try will be the key to solving this puzzle.
In the meantime, I want to hear from you, the website owners. Have you ever checked your website's average engagement time on Google Analytics? How are your numbers looking? Did you notice a change in the graph since summer 2023?
Let's share our stories and help each other out. Together, we can figure out anything that comes our way.
Update April 8, 2024: It was the AMP!
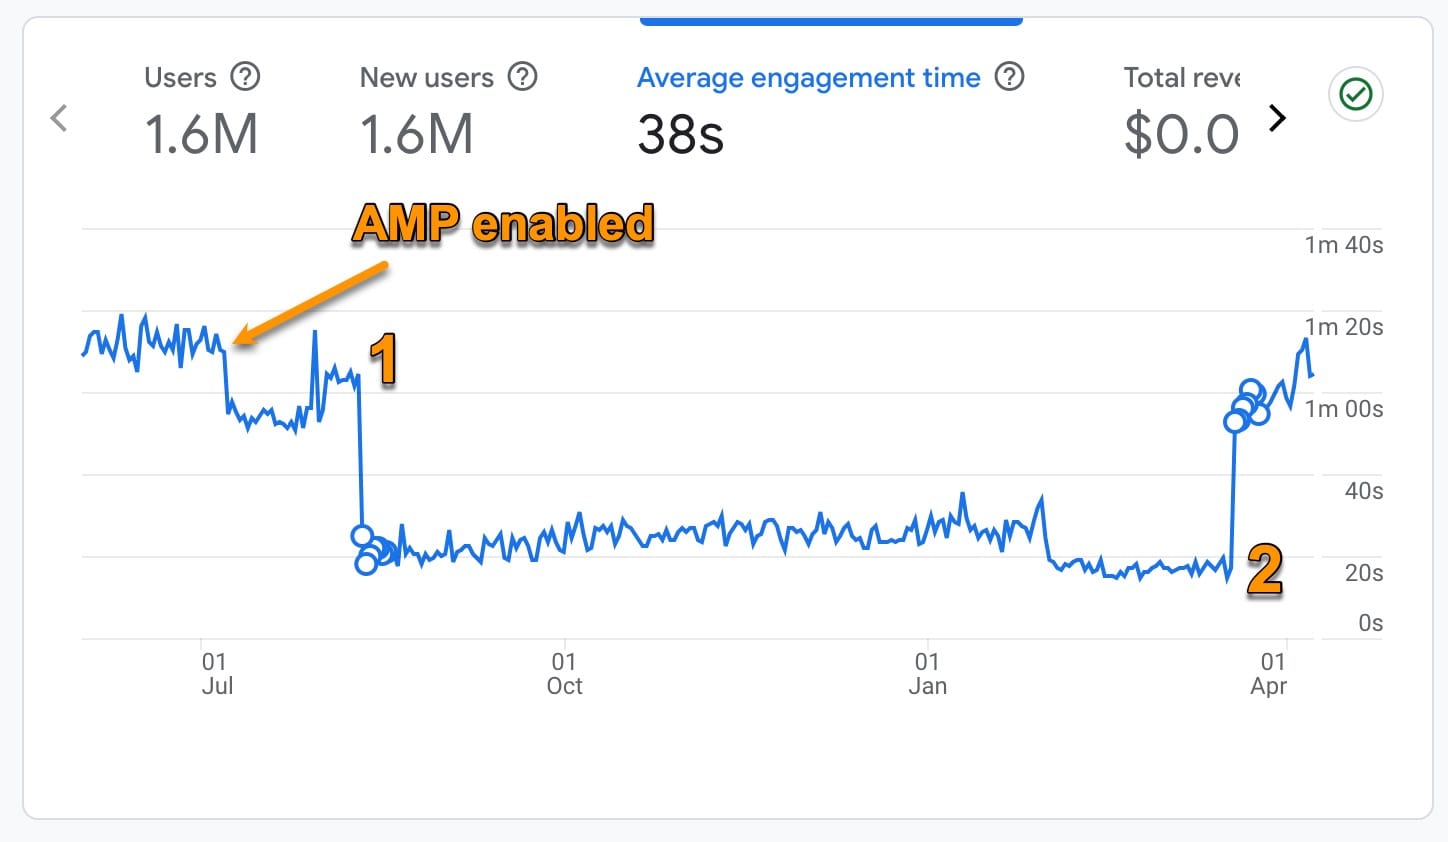
Finally, I figured out what happened in July 2023!
I enabled AMP on July 8, 2023, which immediately sent the average engagement time down by 40%.
How I made the discovery: Advertisers began suggesting this week I disable the website's AMP version. Initially, I declined. I thought AMP helped the website run faster on mobile phones despite having a really robust theme for both desktop and mobile users. Besides, Google used to recommend it.
Then, a second major advertiser that I am currently in talks with to take over the advertising space suggested the same. They implied that AMP pages have a negative impact on ads performance, according to other web publishers! Now, that sounded interesting to me.
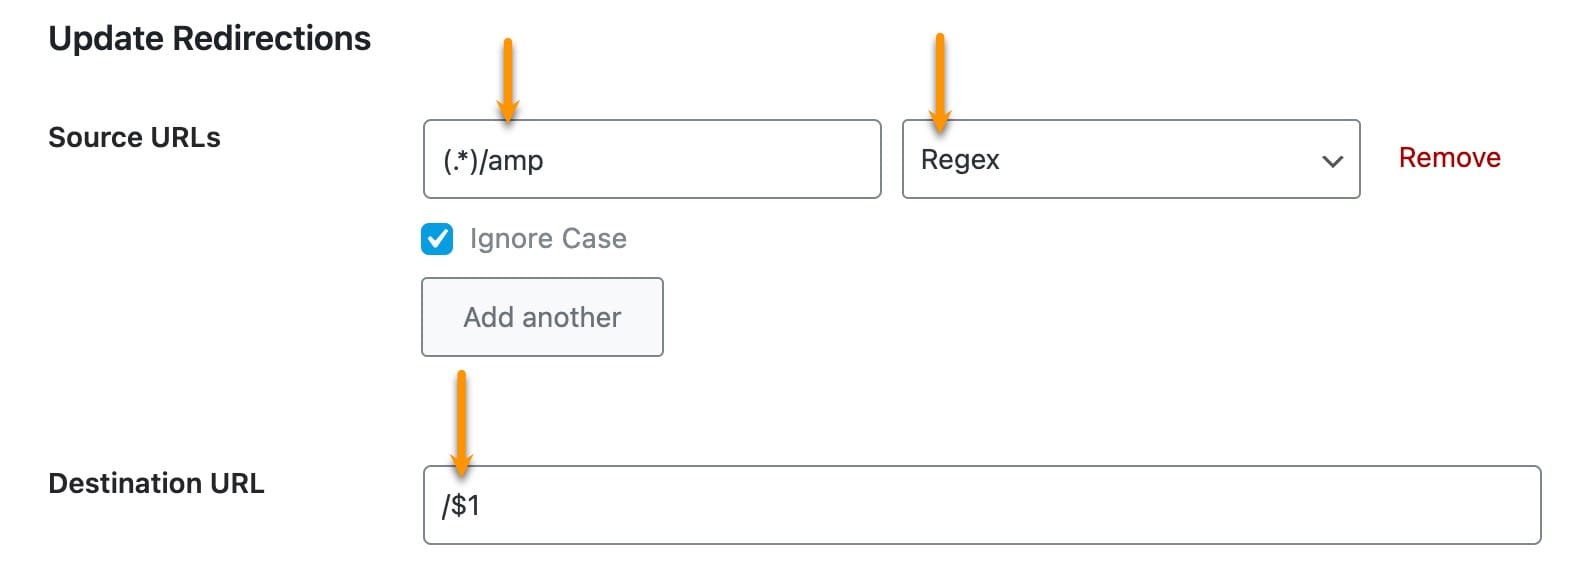
The new upcoming partner was clear that they could not guarantee the same profitability, as long as I was running an AMP version. Say no more. AMP disables, redirect enabled so that I don't lose mobile traffic to 404 error pages.
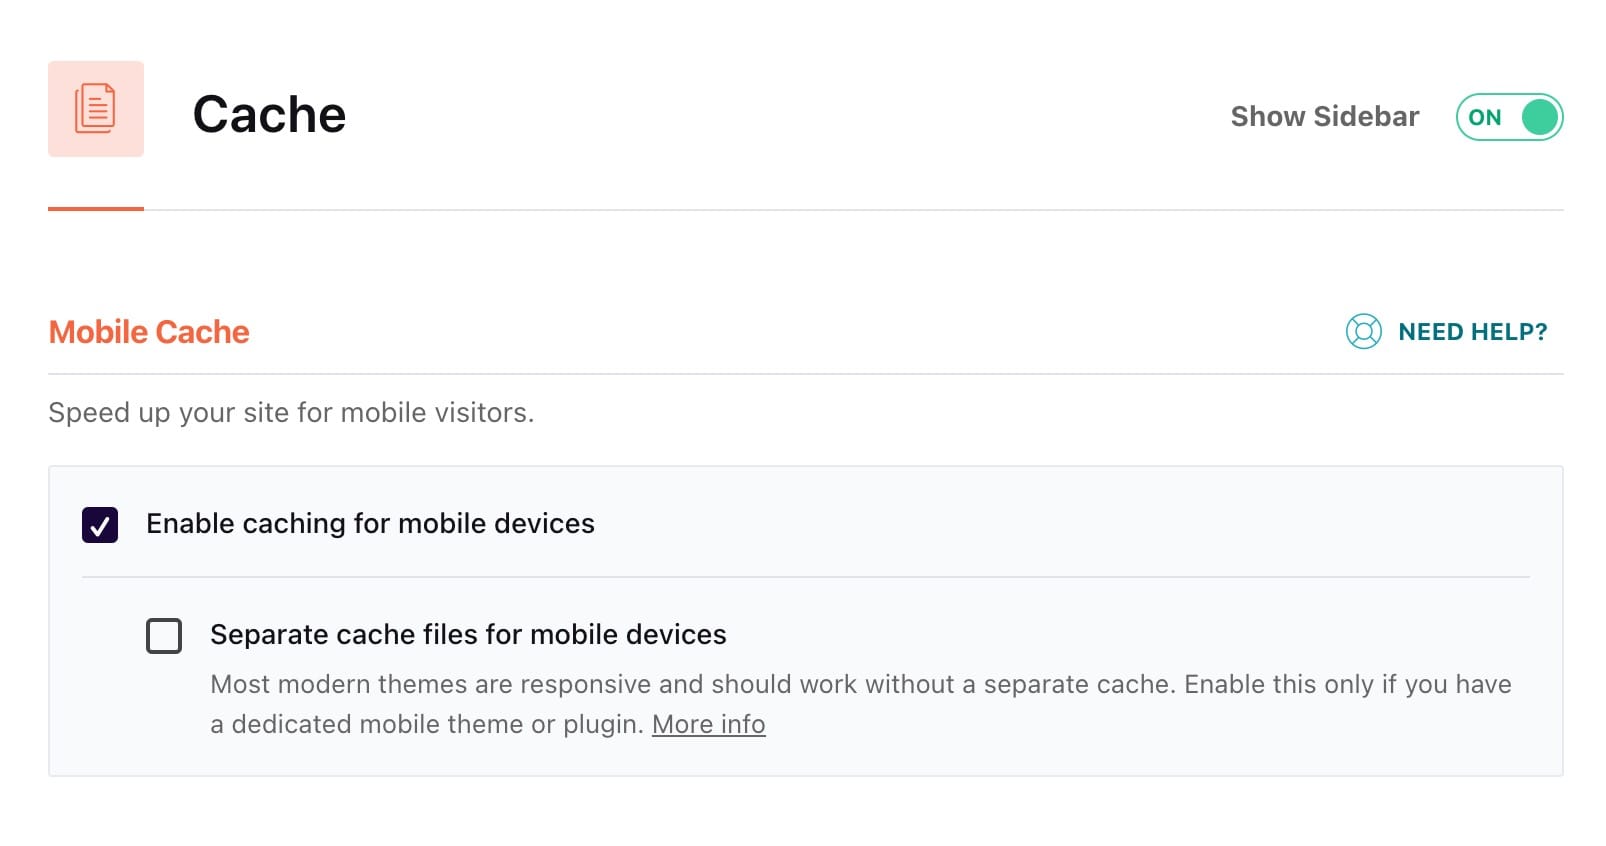
Also, I made sure WP Rocket (my favorite cache plugin for Wordpress) no longer create a separate cache version for mobile users.
As I am now waiting to see how the average engagement time will react, I decided to check when I installed AMP for the first time.
Sure, it must have been YEARS.
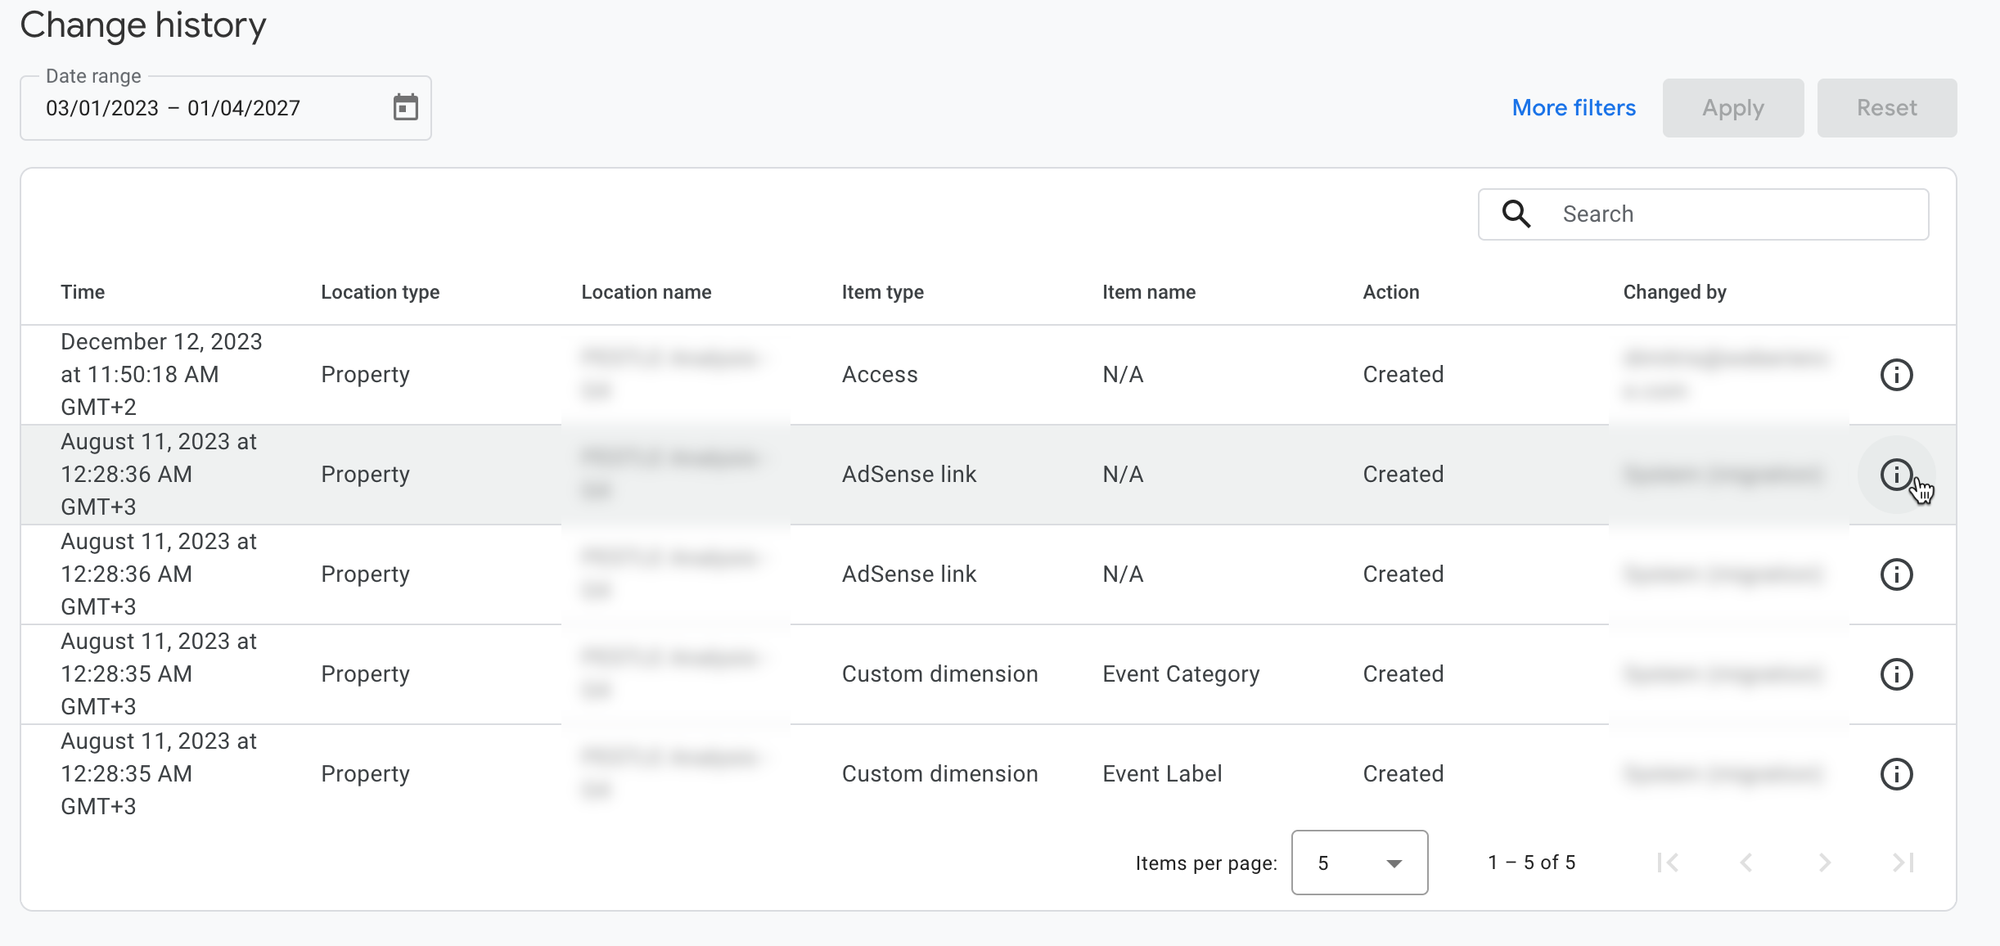
I went to Google Analytics and searched for "/amp" pages on different dates.
- 2021, none.
- 2022, NONE. 🤔
- 2023 March, NONE! 😮
- 2023 August, many.
I froze.
That can't be a coincidence. As I was always confused what happened in July 2023 that led the average engagement time metric to drop, suddenly I was about to find the answer I was looking for!
I entered July 7. None.
I entered July 8. /amp FOUND!
OMG! I did that! I hurt my own website's performance! All by myself.
A bittersweet moment as it's only been 10 minutes since I found out. On one hand, I finally figured out what happened on that day (tip: make a journal of changes you make to your website by dates). On the other hand, I was responsible for the decline.
Yes, but what about the massive decline in August (point 1)? I have no idea.
I have no idea what happened in March 2024, either (point 2).
But at least I can now explain why engagement dropped in July. It was the AMP.
Now, let me keep an eye on the average engagement time following the disabling of the AMP functionality and report back in a couple of days or weeks.