Betfair trading is all about odds movement. By learning basic terms of technical analysis like support and resistance, and applying them to Betfair graphs, we are able to make money by correctly predicting them.

I included 7 betfair graphs from yesterday’s horse racing betting markets in this article and I try analyzing and discussing the various support and resistance levels in them. I used to study about technical analysis in the past years when I traded the Betfair UK Horse racing markets and I applied the same knowledge back then to make about 10,000 euros per month. I’m not sure if they can be applied profitably in today’s markets but they will certainly help you understand and predict the odds movements more efficiently.
Learn about Betfair trading and read the latest news about sports trading in my new trading blog!
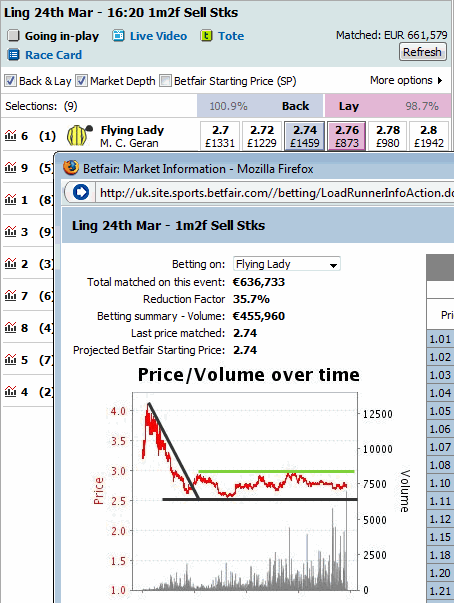
At the 16:20 horse race the favorite horse was Flying Lady. The betting odds graph started in a downtrend moving the odds from 4.00 to 2.60 initially. Later on the odds retraced and almost reached 3.00. If we take a look at the previous peak on the black trendline, that peak was at 3.00. We could have expected a retracement up to that point, since the down trend was interrupted when the odds broke above the black trendline. After the second touch at 3.00, we are now sure that 3.00 is the resistance level of the betting odds and we don’t expect it to be overcome, unless the odds resume an uptrend. In the following minutes the odds fall down to 2.50 only to climb once again up to 3.00 and end up at 2.75 right before the start of the race. The competent betfair trader could possibly take advantage of the steaming odds from 3.00 to 2.50 once the resistance level was confirmed, while a second profitable and successful trade could have been made during the last move from 3.00 to 2.75.
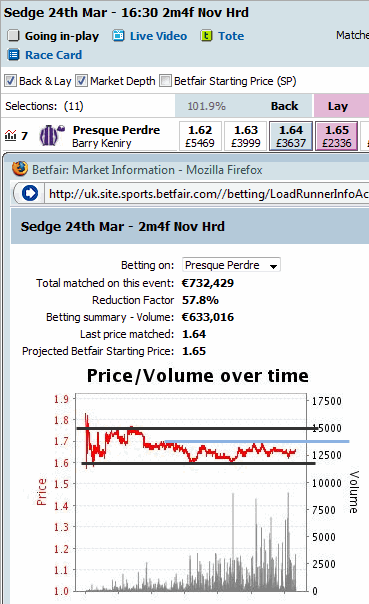
In the next horse race, the horse called Presque Perdre started the race at 1.64, while the betting odds had previously ranged between 1.75 and 1.60. Once again we had a confirmation of the support level quite a few times, making the trading to seem quite easy laying first and backing later whenever the odds touched 1.60. A second resistance level could have been considered at 1.70 afterwards, although a much safer trading would have been to lay at 1.60 and closing the position a couple of ticks above, securing small profits.
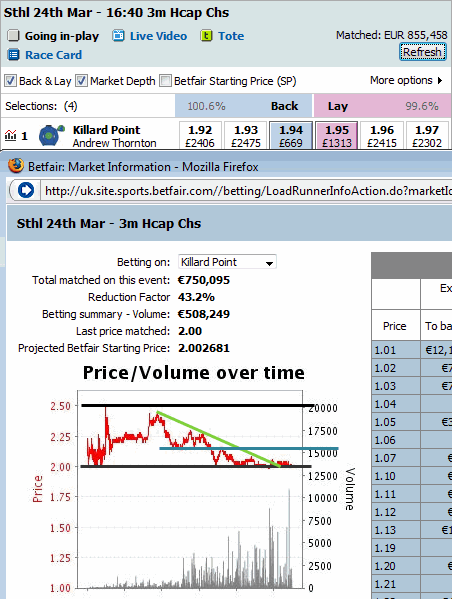
At 16.40, Killard Point offered enough trading opportunities for profitable trading before the start of the race. Right from the beginning we confirmed the resistance level at 2.50 and the support level at 2.00. So, when the betting odds reached 2.45 where the green trendline begins, we could back the horse and make money from the downtrend up to 2.00, while if we were wrong, we would have placed our stop loss at 2.55. In other words we risked 5 ticks to win 20. In the end we would have won the whole downtrend of the odds, although we could have split our trading into smaller trading moves. An example of that is when the betting odds found a support level at 2.20 (blue line). When the odds moved below 2.20, the support level converted into a resistance level. In the main betting exchange interface we see that the betting odds have moved below 2.00 and have reached 1.95, but 30 seconds before the start of the horse race, it isn’t the most appropriate time to open a trading position having very few seconds to complete our trade.
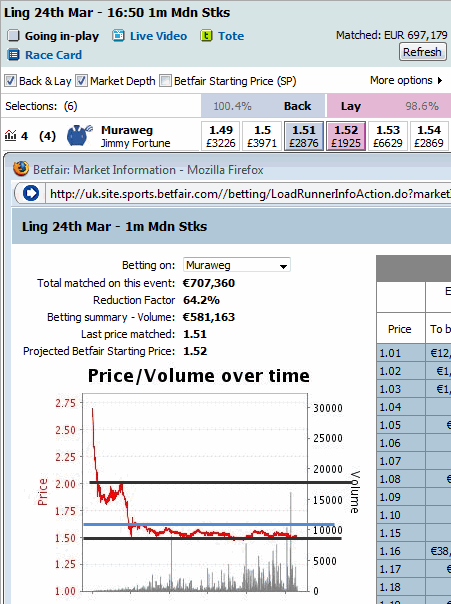
During the horse race at 16:50 the betting odds literally plumbed. In the beginning of the downtrend the odds found some support level at 1.80, but the retracement to 2.00 wasn’t strong enough to stop the forthcoming continual of the downtrend. When the odds retracement is relatively small in comparison with the move that has preceded (2.75 to 1.80), it is a good sign that the trend has neither ended nor lost speed. Indeed the cautious betfair trader would have backed at 1.75 when the odds broke below the support level at 1.80, while a more risky trader would have already backed the horse at 2.00 for bigger profits. From that point on and like in the previously mentioned betfair graph, the odds ranged between 1.50 and 1.60 where they found support and resistance. Safe trading could have been made by backing first at 1.50, since it wasn’t expected to be overcome having the odds touched 1.50 so many times. Surely the profits wouldn’t have been that significant as in the initial downtrend, however that doesn’t mean there weren’t trading opportunities.
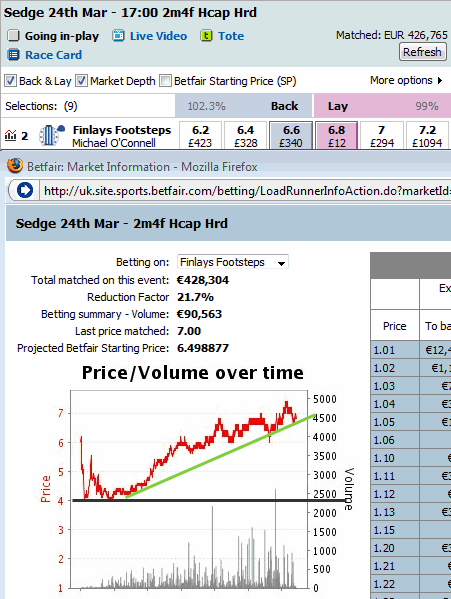
At 17:00 there was the most predictable odds movement, when the favorite horse called Finlays Footsteps climbed from 4.00 to 7.00 losing at the same time the favorite place. In the beginning of the betfair graph, the odds have found support level at 4.00 and they entered a strong continuous uptrend. When the horse racing betting odds show such signs, the worst a trader can do is to back that horse. If we couldn’t predict the uptrend at 4.00 or 5.00, we still had a chance for 2 profitable trades when the odds traded at 6.00. The odds found resistance level at 6.00 but when they overcome it, the resistance level converted into a support level and the odds moved twice from 6.00 to 7.00 afterwards. Always have in mind that when a level is broken, it is converted in the exact opposite kind of level. While the odds had difficulty overcoming 6.00 after a strong uptrend, they never fell below upon breaking the resistance level.
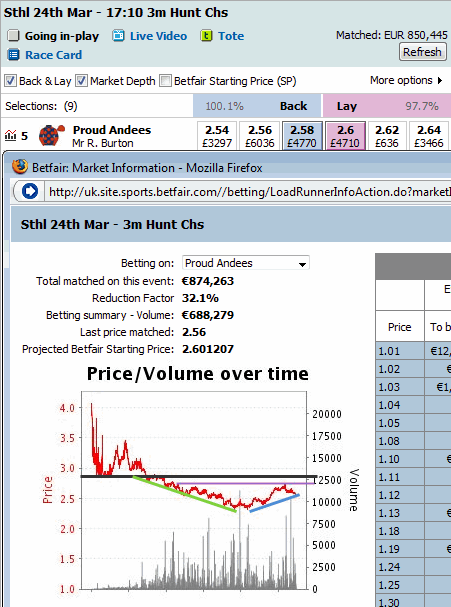
At 17:10 the betfair graph starts like the previous one with the support level found at 2.90, but this time the odds broke below the support level which was a major indication of a forthcoming downtrend. The odds moved continuously to lower lows until they found support at 2.40. Then they retraced up to a resistance level at 2.70. I believe there was a good trading opportunity when the support at 2.90 was broken, while it would have been difficult to predict the following weak uptrend.
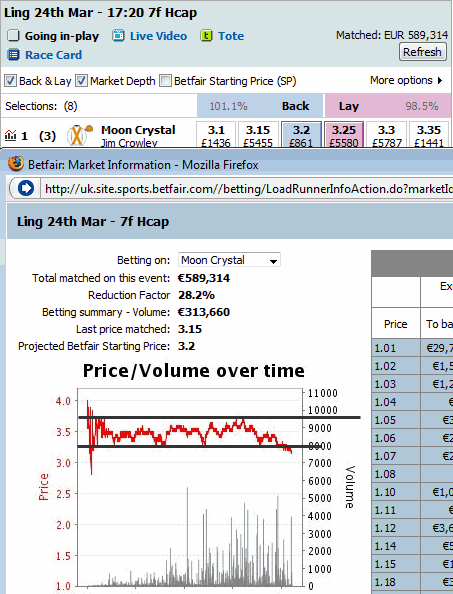
Finally in the horse race at 17:20, the odds didn’t trend but rather ranged between 2 levels. Upon reaching 3.30 for the third time, I think that would have been a safe trade by laying there and closing at 3.70. At that time, it would have been another safe bet to back at 3.70 and make money from the forthcoming fall. In the end of the graph the support level’s break is of little importance, since the remaining time until the start of the race is simply too short to be trading.
We analyzed 7 betfair graphs in UK horse racing for better understanding and prediction of the betting odds movement. The methods of technical analysis don’t stop to terms like support, resistance and trendlines, but they contain innumerous indicators, oscillators and formations. However, on one hand the available basic betfair graph doesn’t allow for deeper analysis, while on the other hand by using the most simple terms of technical analysis, it is possible to predict odds movements and make money in betfair trading.
Interested in more technical analysis for betfair graphs?